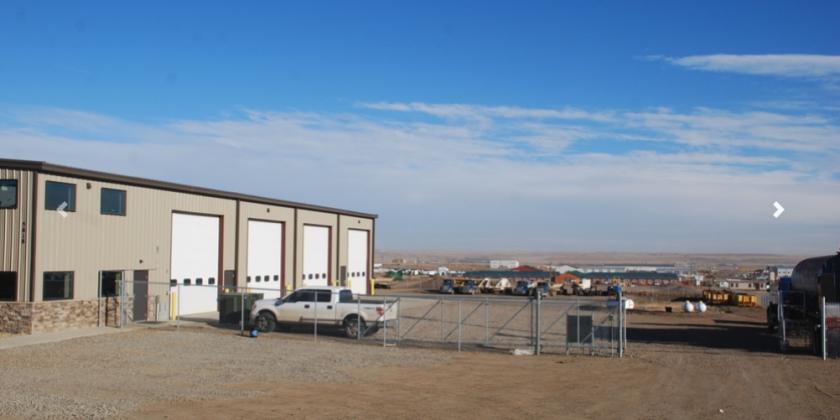
Flex-Office-Warehouse
5818 Jefferson Lane Williston, ND 58801
5818 Jefferson Lane Williston, ND 58801
Details & Description
Property Highlights
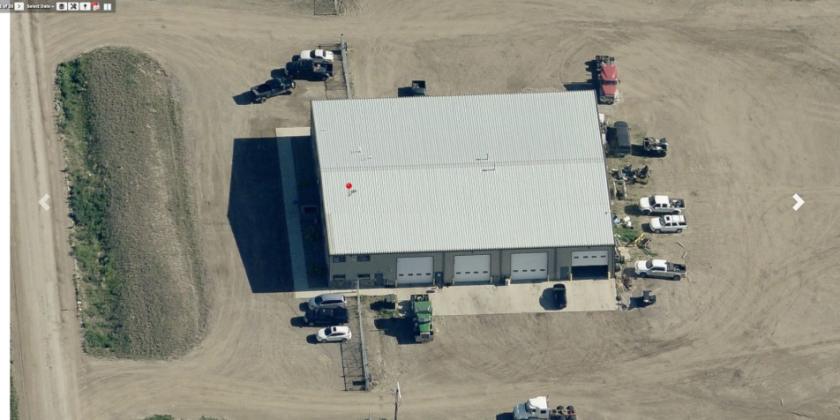
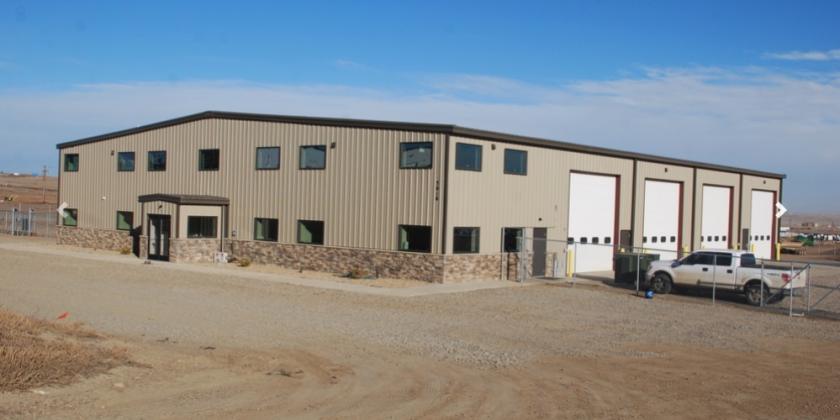
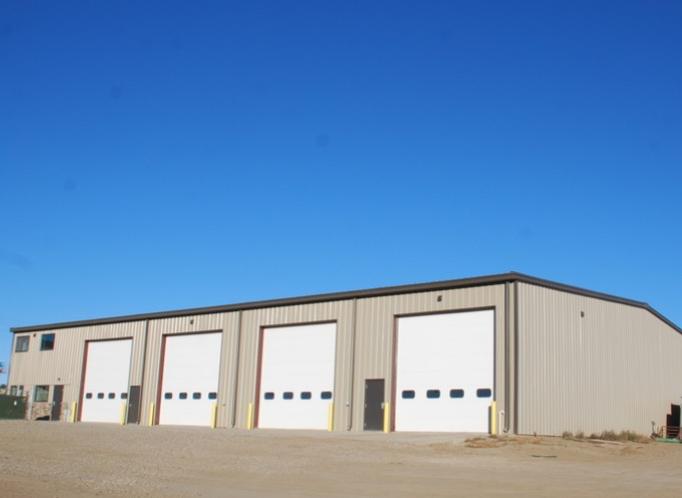
- • Flexible, Expandable, Well Constructed Building
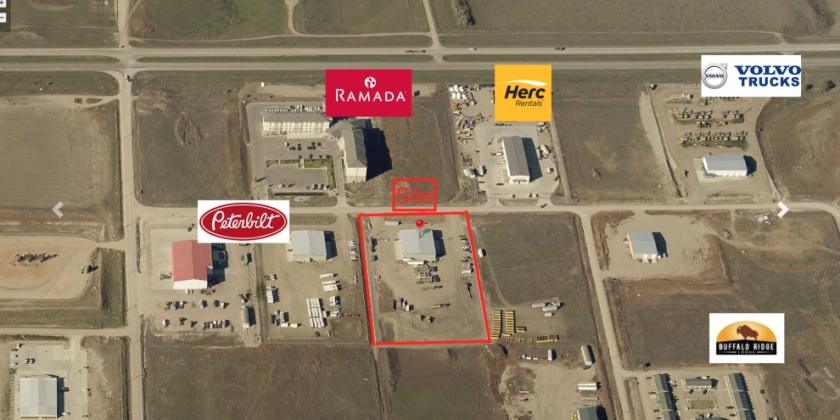
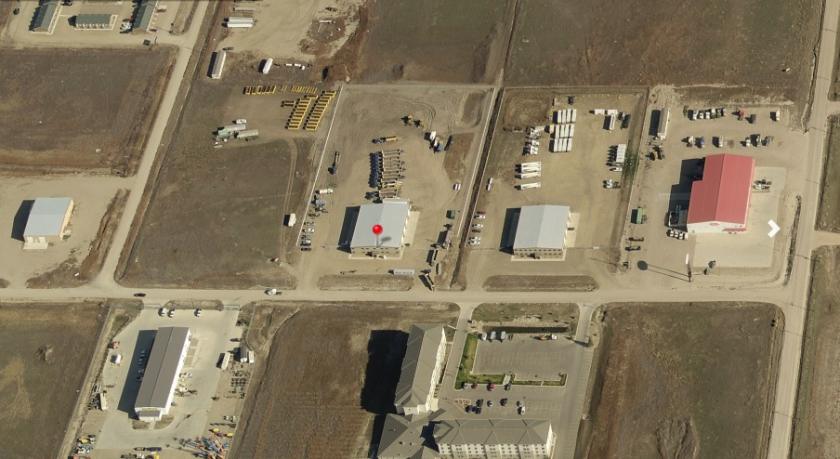
- • 5 Acre, Fenced Lot, Graded, and Compacted Gravel.
- • +/-2,500 SF -Well-Appointed Offices
- • Owner will consider Contract For Deed.
Additional Photos

Listing Agents

Michael Houge
O: 612-701-7454
M: 612-701-7454
michael@nailegacy.com
O: 612-701-7454
M: 612-701-7454
michael@nailegacy.com

Erik Peterson
M: 701-369-3949
erik@provenrealtynd.com
M: 701-369-3949
erik@provenrealtynd.com
While we strive to provide the most accurate information, all listing information, and demographic data, is provided by third-parties. As such, MyEListing will not be responsible for the accuracy of the information. It is strongly recommended that you verify all information with the listing agent, and any relevant agencies, prior to making any decisions.