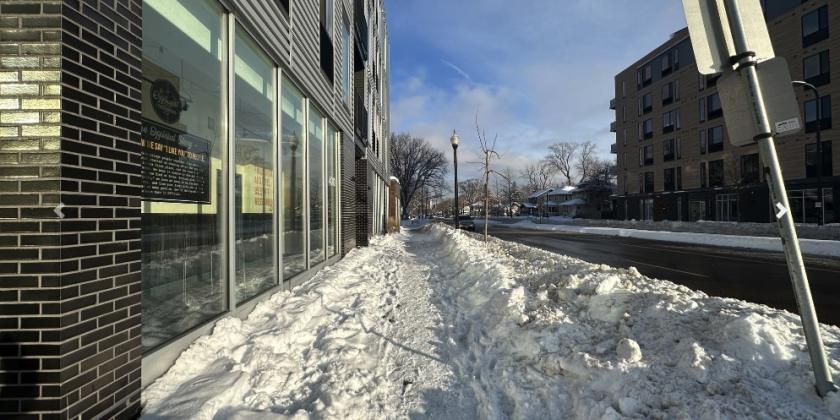
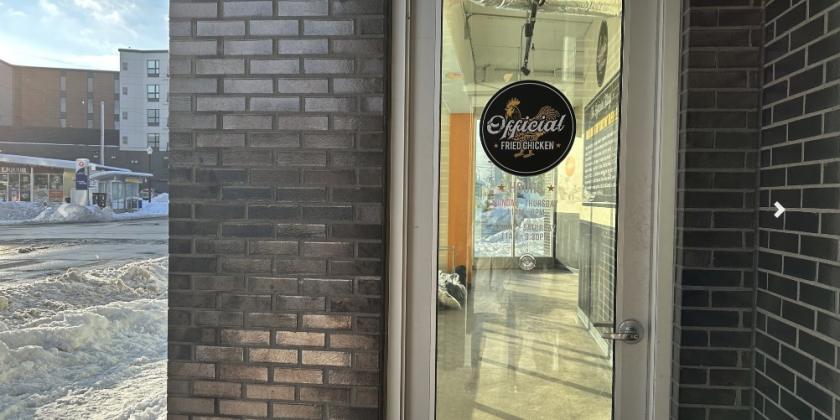
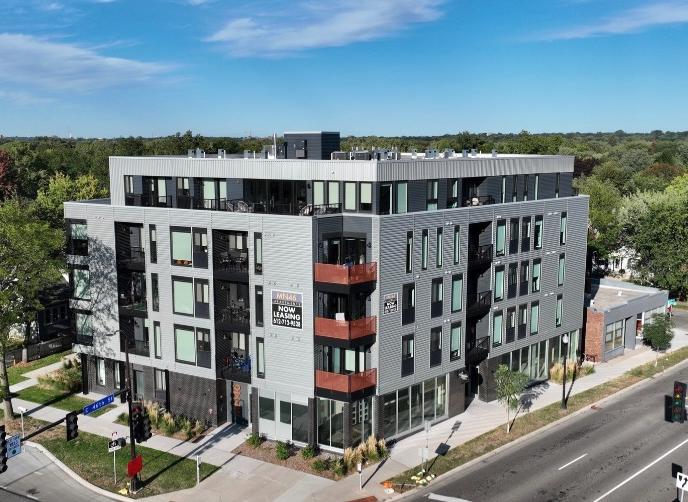
Retail Space
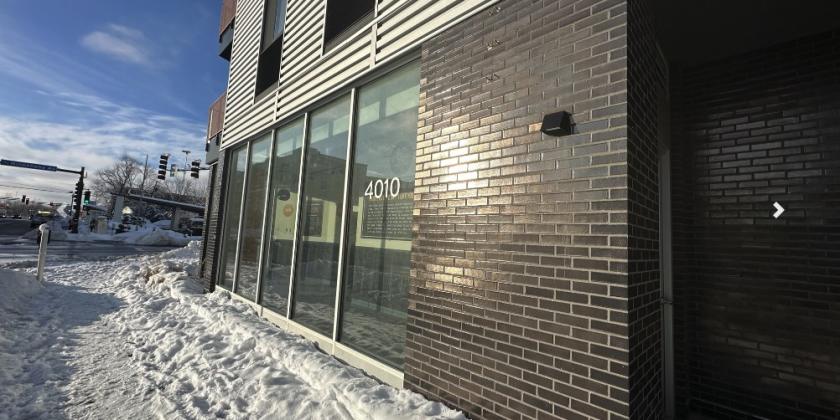
4010 East 46th Street Minneapolis, MN 55406
4010 East 46th Street Minneapolis, MN 55406
Details & Description
Property Highlights
- • High Occupancy Apartments Above Retail Space
- • Easily Demisable Walls
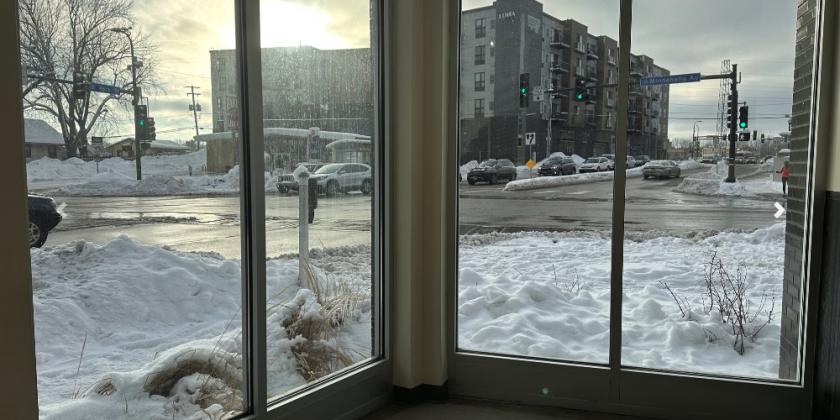
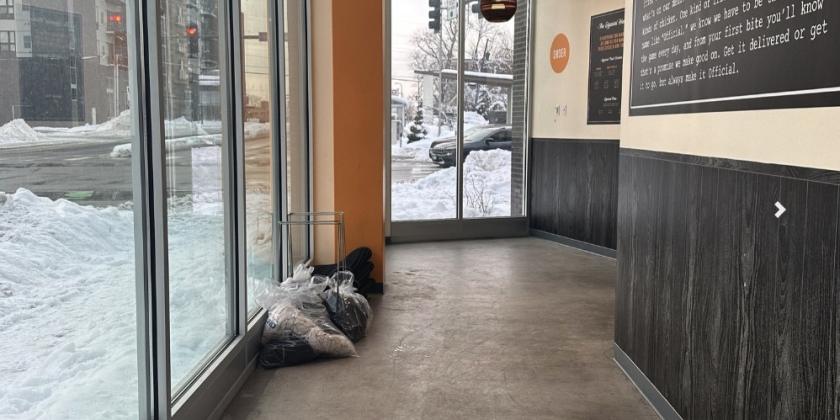
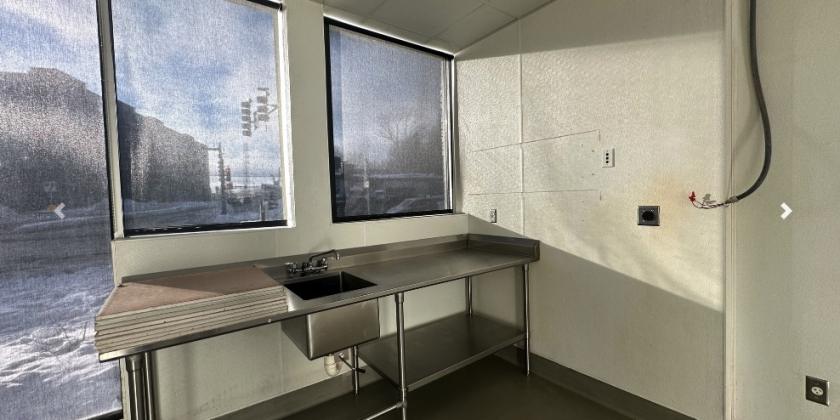
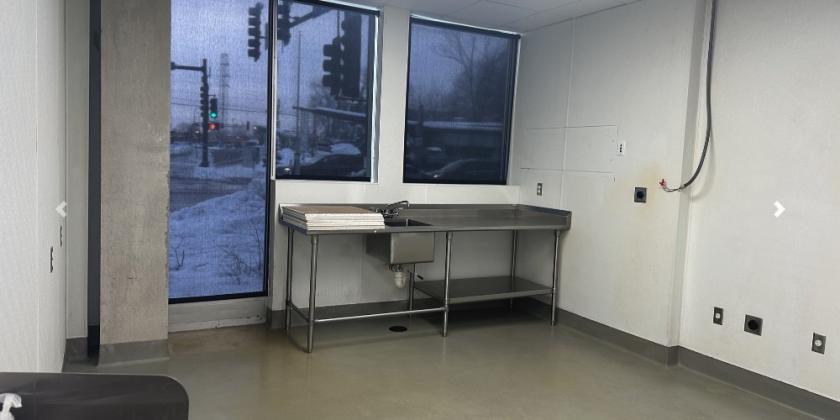
- • Floor to Ceiling Windows on Two Walls
- • Rapidly Developing Neighborhood
- • Hard Corner with High Visibility
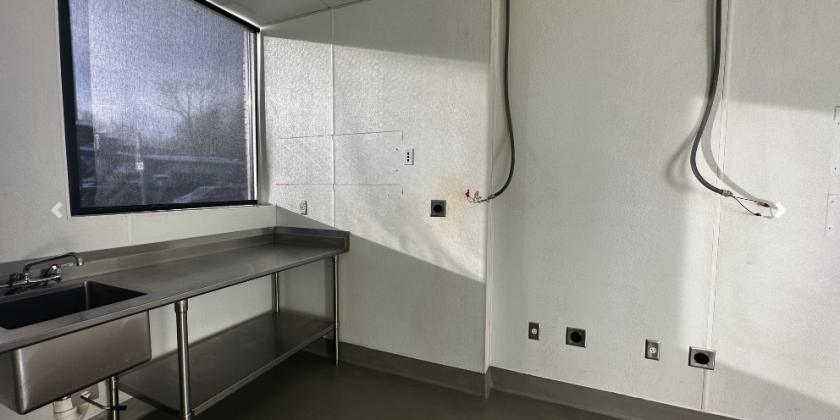
Additional Photos
Listing Agents

Chris Missling
O: 612-812-1317
M: 612-812-1317
c.missling@nailegacy.com
O: 612-812-1317
M: 612-812-1317
c.missling@nailegacy.com

Amelia Bjorklund
M: 952-491-3069
amelia@nailegacy.com
M: 952-491-3069
amelia@nailegacy.com
While we strive to provide the most accurate information, all listing information, and demographic data, is provided by third-parties. As such, MyEListing will not be responsible for the accuracy of the information. It is strongly recommended that you verify all information with the listing agent, and any relevant agencies, prior to making any decisions.