Office Space
7704 South Loop 1604 East Elmendorf, TX 78112
7704 South Loop 1604 East Elmendorf, TX 78112

Details & Description
Property Highlights
• Undersupplied Community for Medical & Professional Services, with Demand & Population Projected to Grow Substan
• 10,000 SF Building on 7 Acres provides for Expansion Area, Storage Yard, Etc.
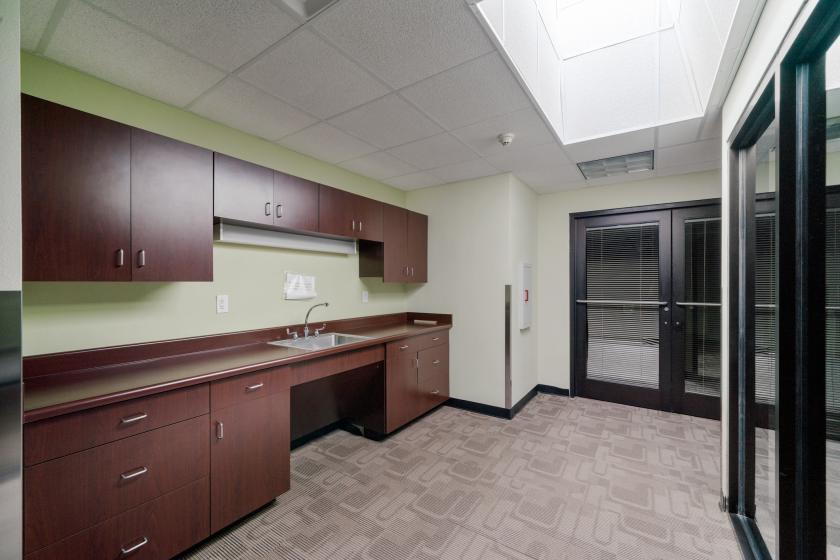
Additional Photos


Listing Agents

James Stewart
O: 210-514-4342
M: 210-514-4342
james.stewart@marcusmillichap.com
O: 210-514-4342
M: 210-514-4342
james.stewart@marcusmillichap.com
While we strive to provide the most accurate information, all listing information, and demographic data, is provided by third-parties. As such, MyEListing will not be responsible for the accuracy of the information. It is strongly recommended that you verify all information with the listing agent, and any relevant agencies, prior to making any decisions.


