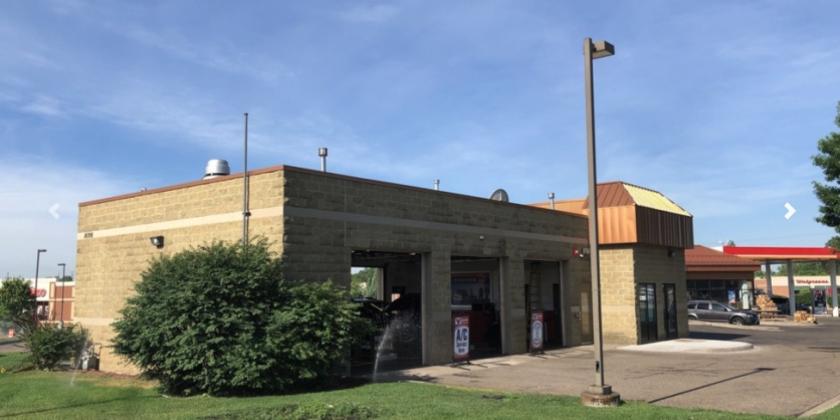
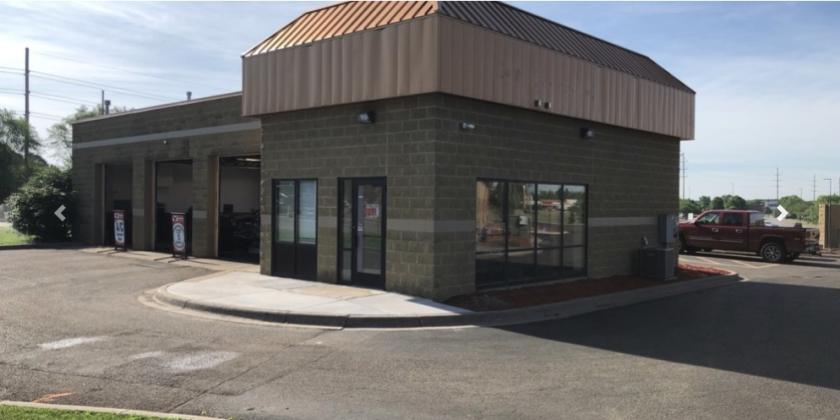
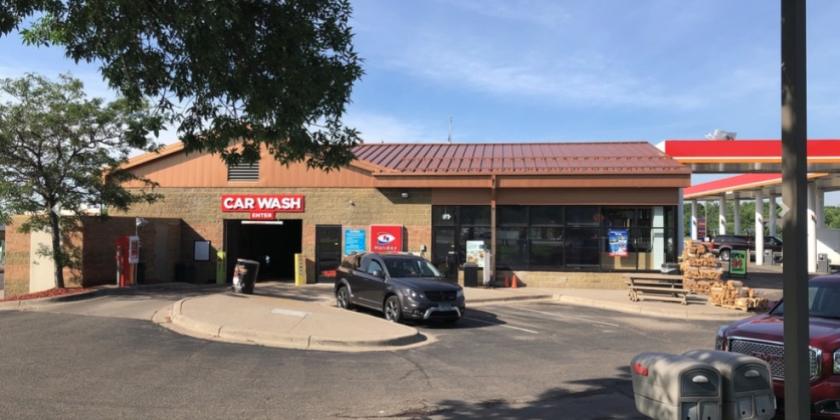
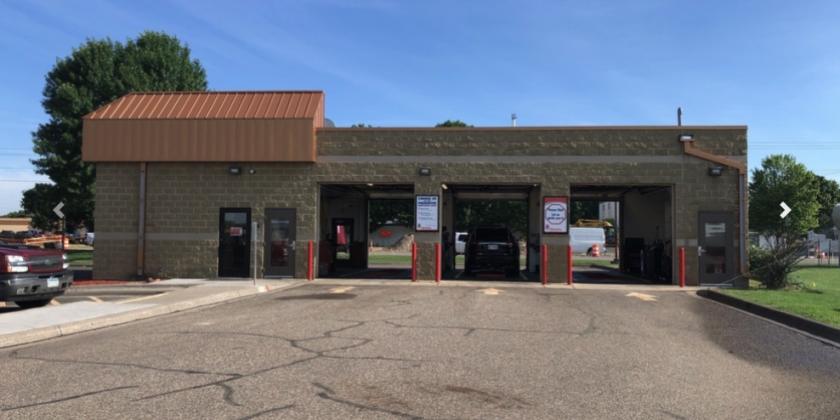
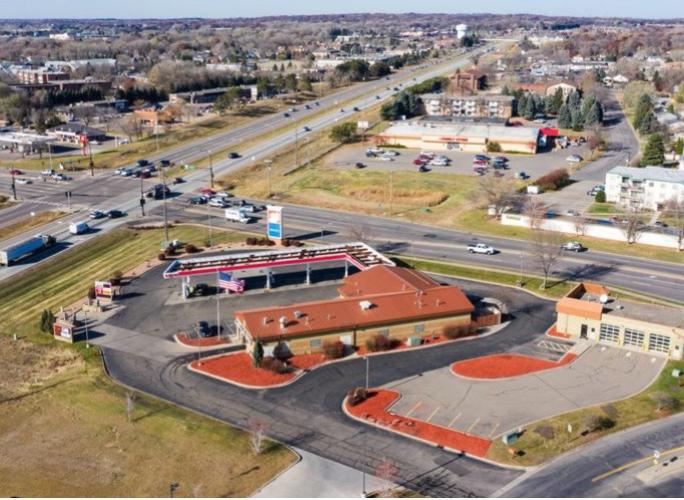
Retail Space
18298 Zane Street Northwest Elk River, MN 55330
18298 Zane Street Northwest Elk River, MN 55330
Details & Description
Property Highlights
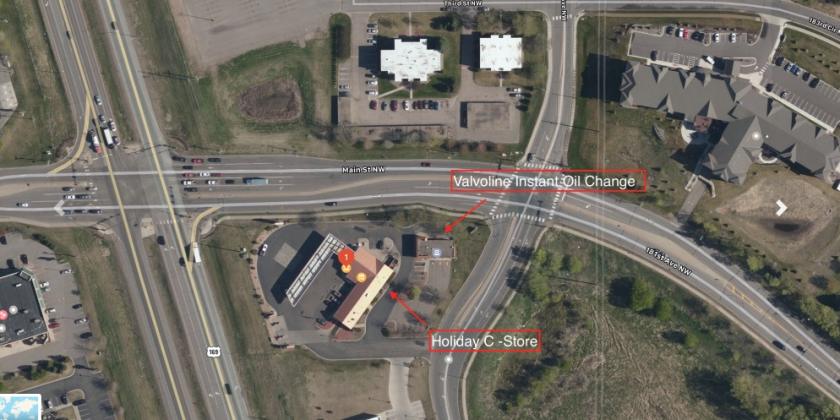
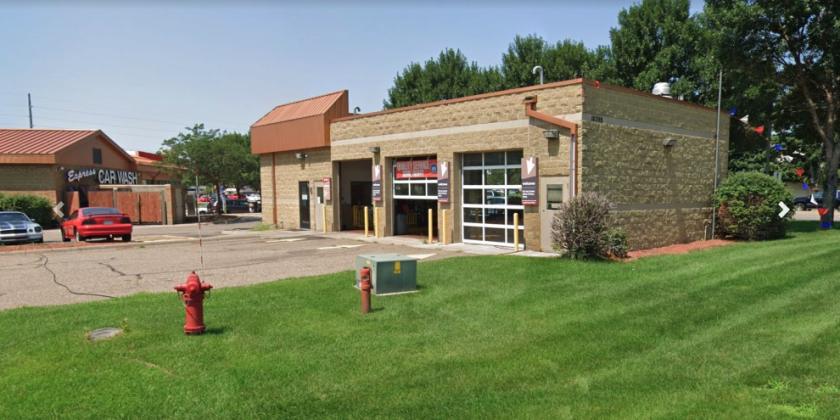
• 10.00% Rent Increases Every Five (5) Years for the Valvoline Instant Oil Change
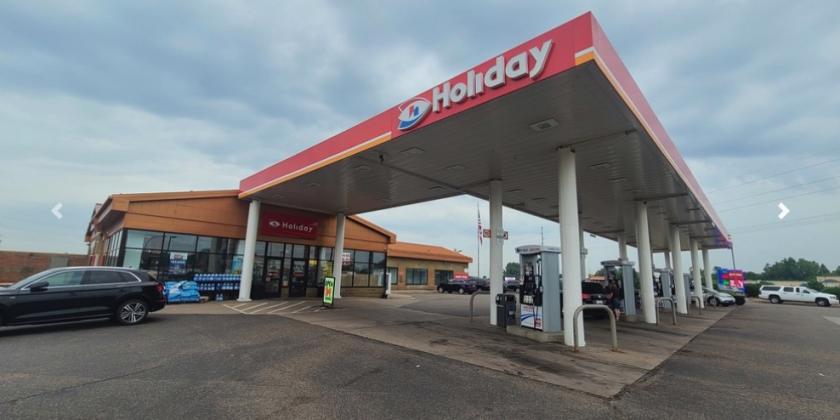
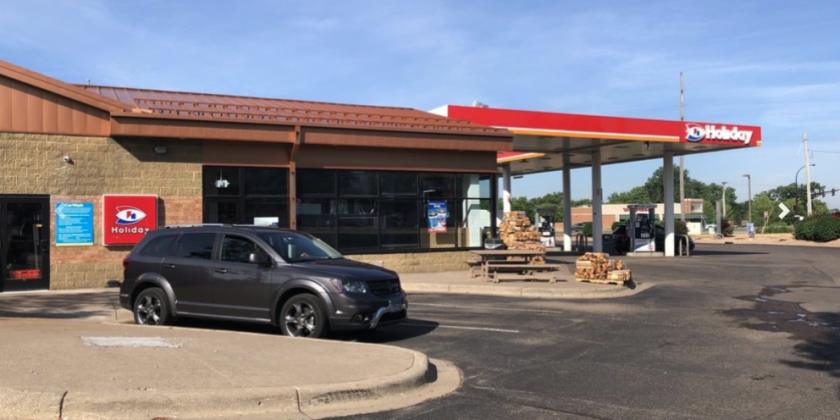
• 2.00% Rent Increases Every Five (5) Years for the Holiday Stationstore
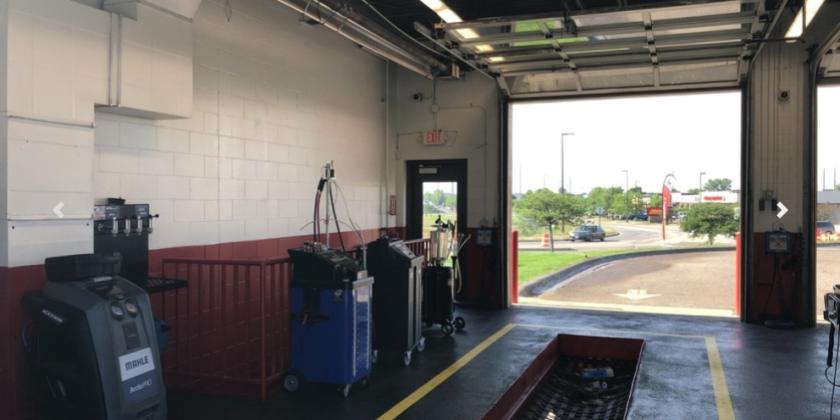
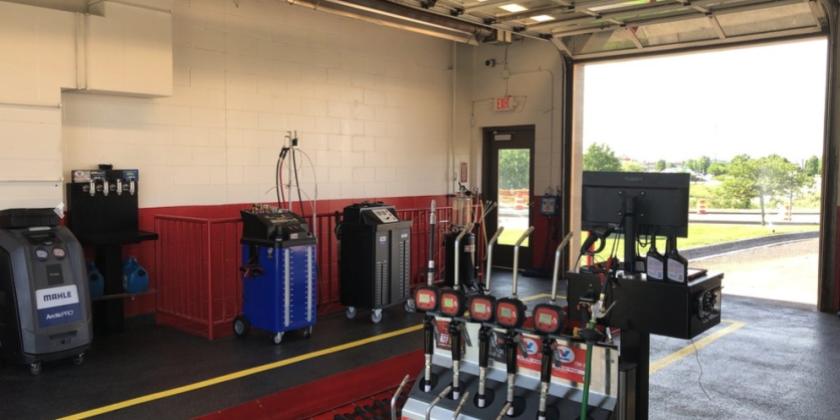
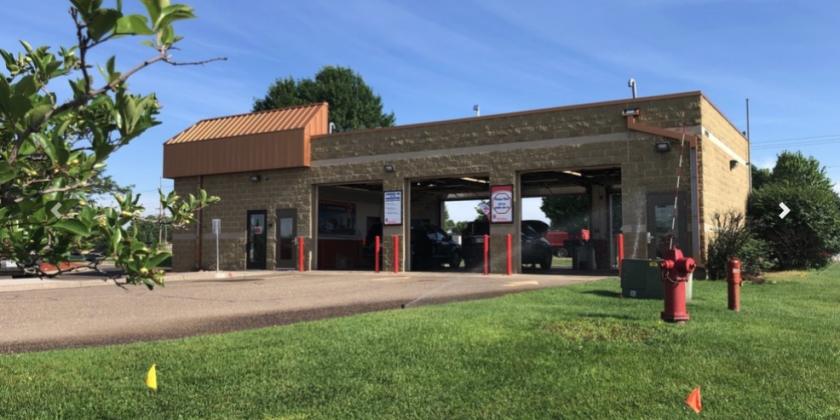
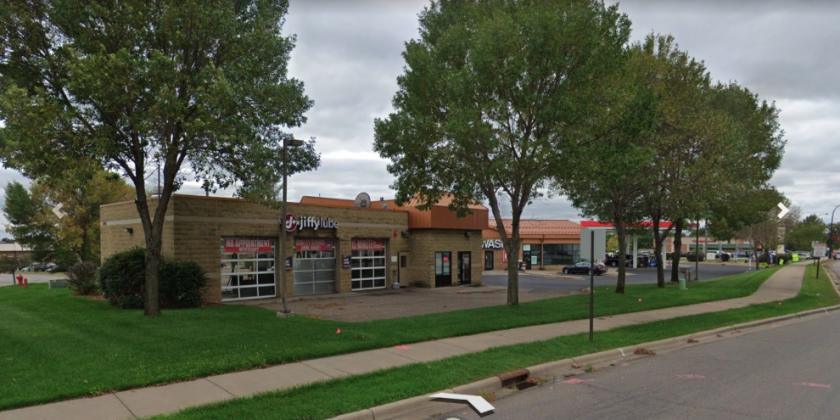
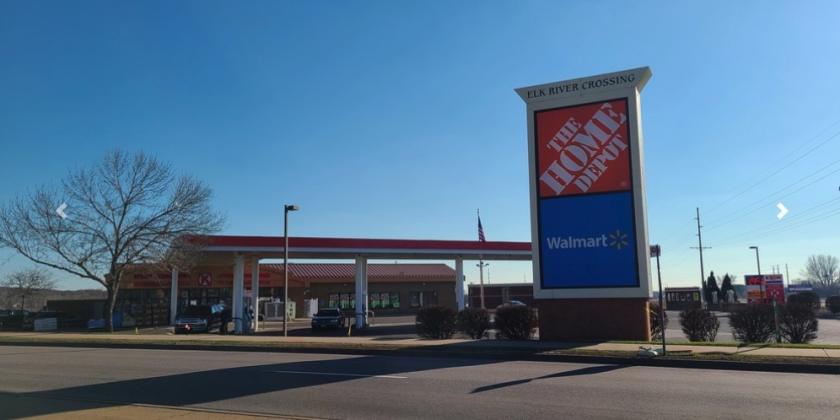
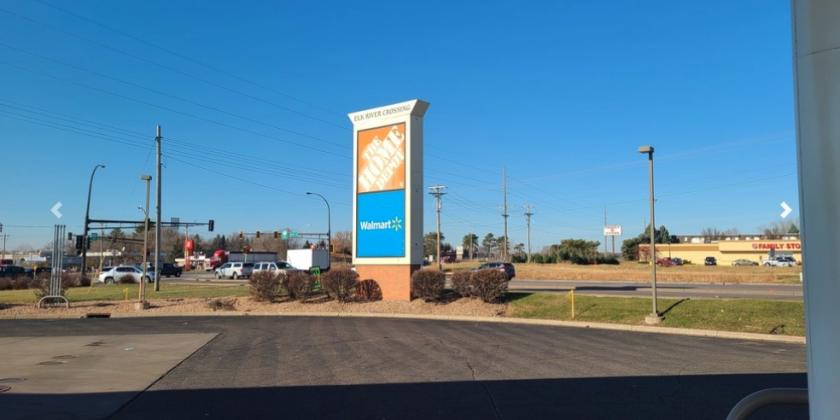
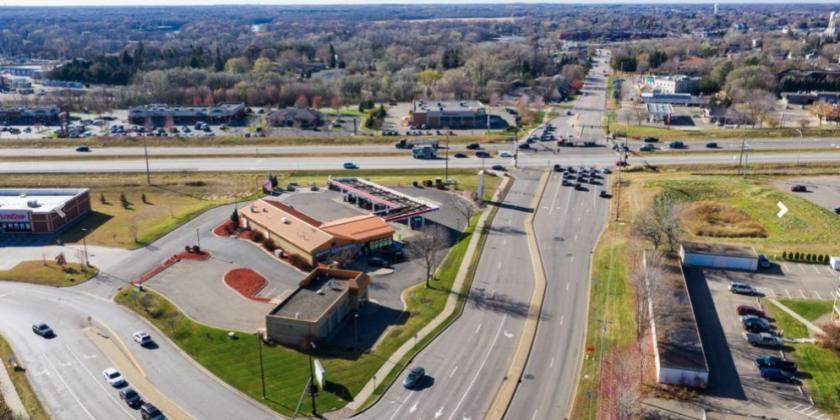
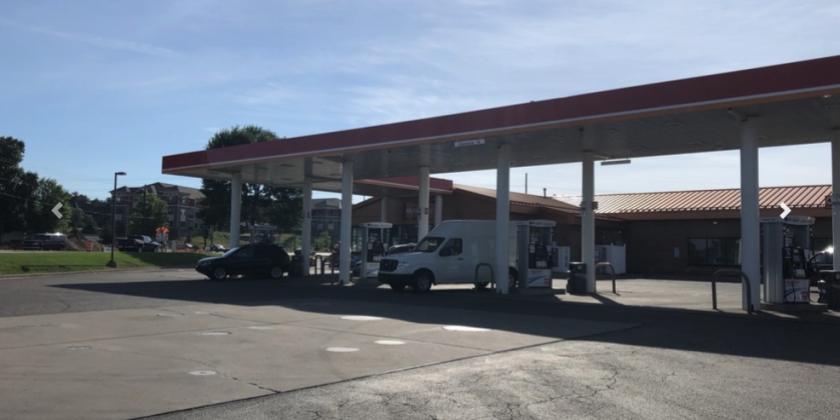
Additional Photos
Listing Agents

Michael Houge
O: 612-701-7454
M: 612-701-7454
michael@nailegacy.com
O: 612-701-7454
M: 612-701-7454
michael@nailegacy.com
While we strive to provide the most accurate information, all listing information, and demographic data, is provided by third-parties. As such, MyEListing will not be responsible for the accuracy of the information. It is strongly recommended that you verify all information with the listing agent, and any relevant agencies, prior to making any decisions.