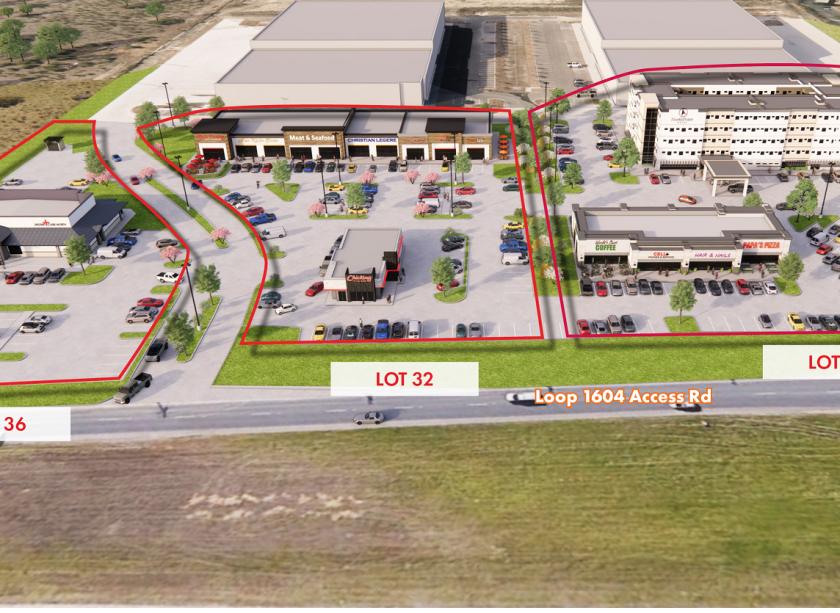
Commercial Land
7102 TX-1604 Loop San Antonio, TX 78247
7102 TX-1604 Loop San Antonio, TX 78247
Details & Description
Property Highlights
- • Lots can be subdivided
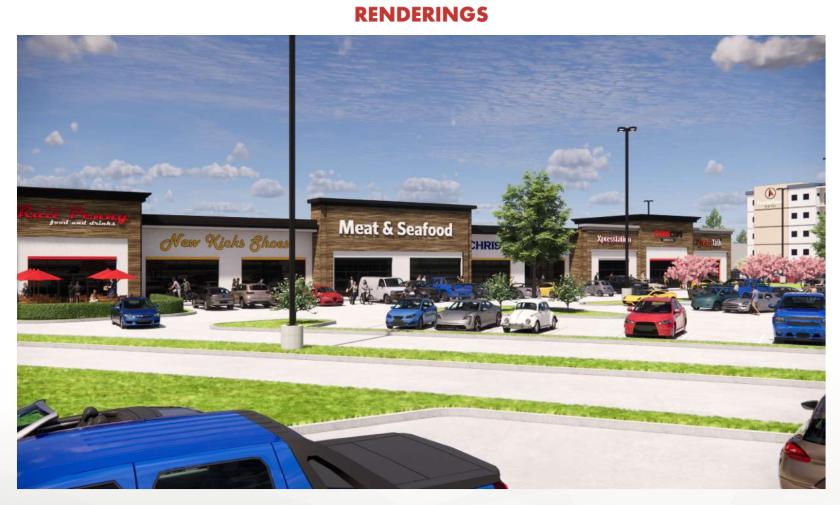
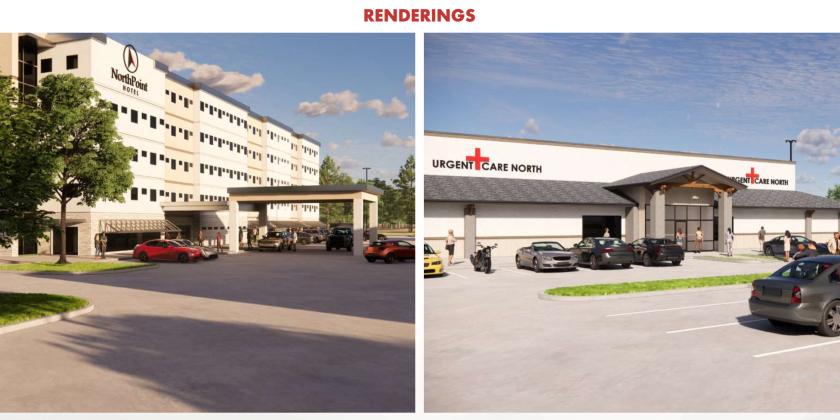
- • Build-to-suit and ground lease opportunities
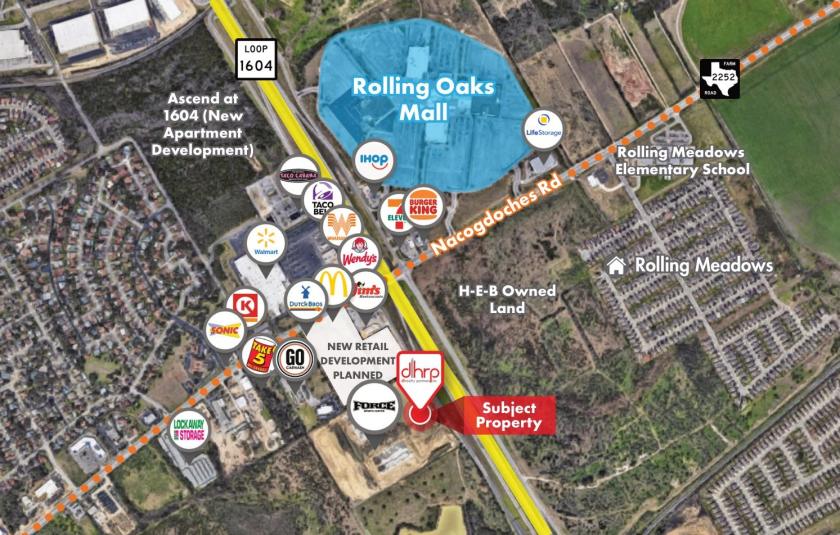
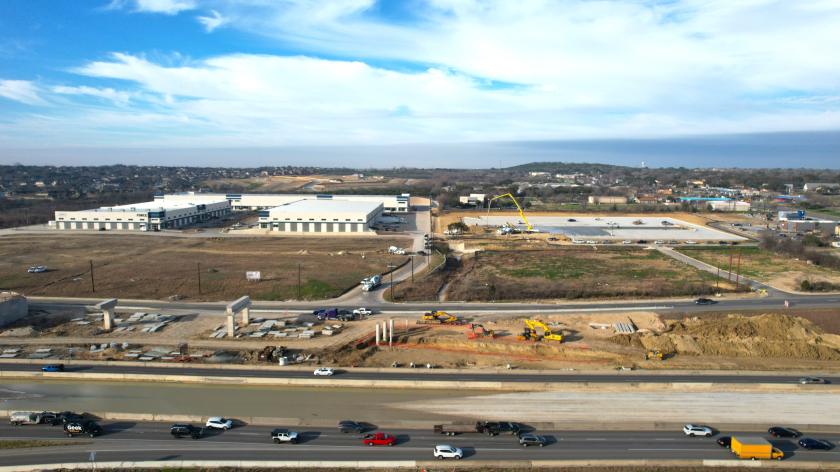
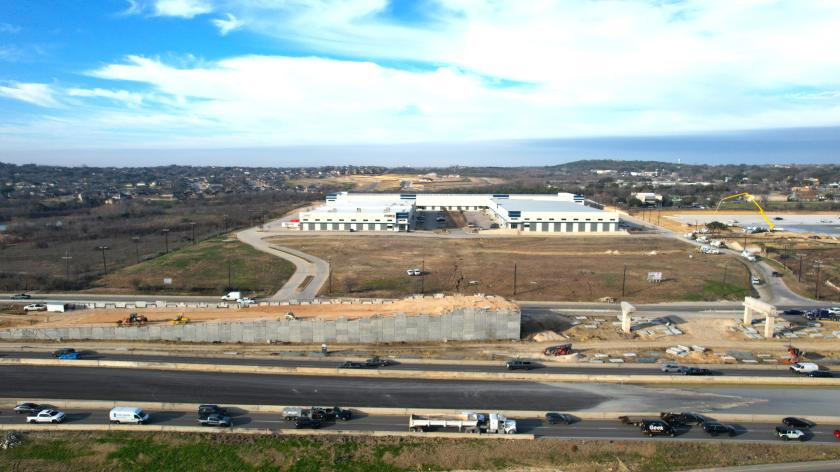
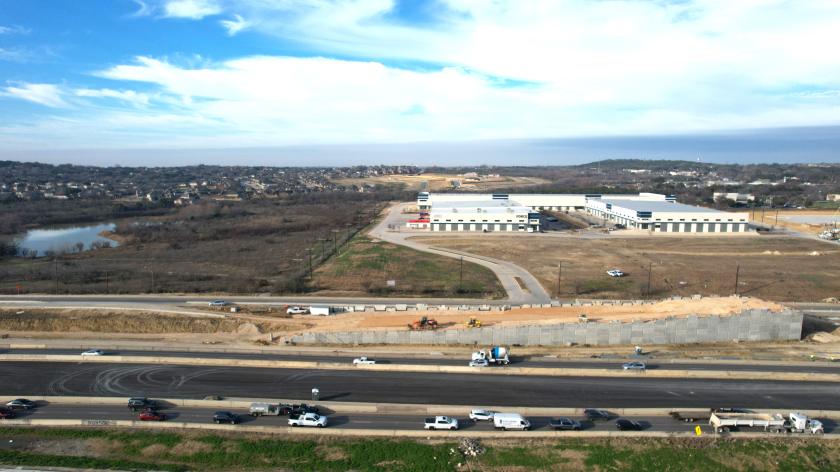
- • High traffic intersection
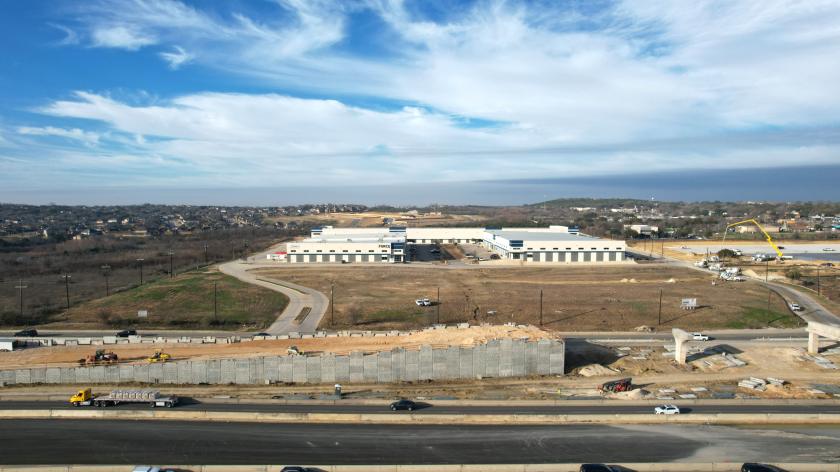
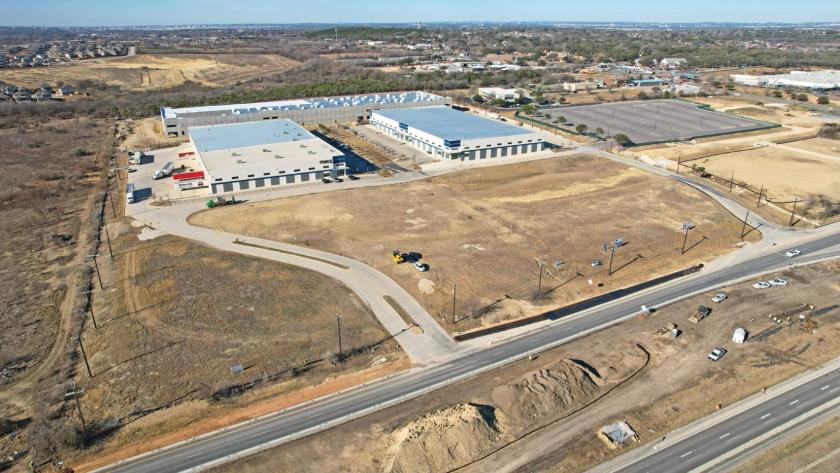
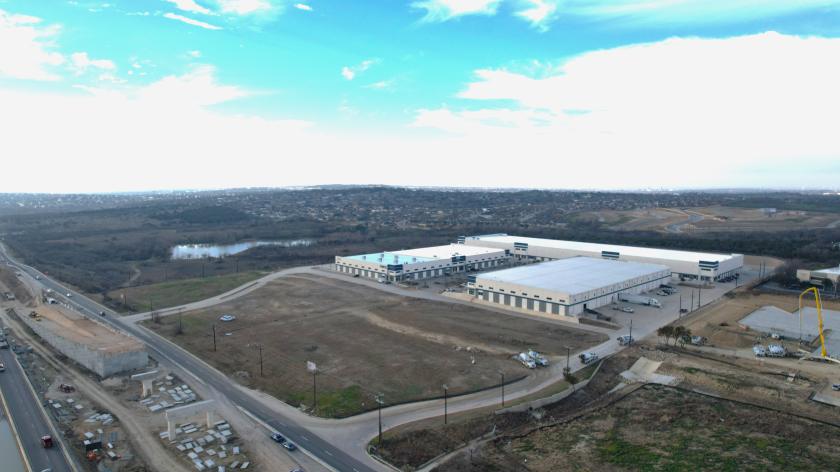
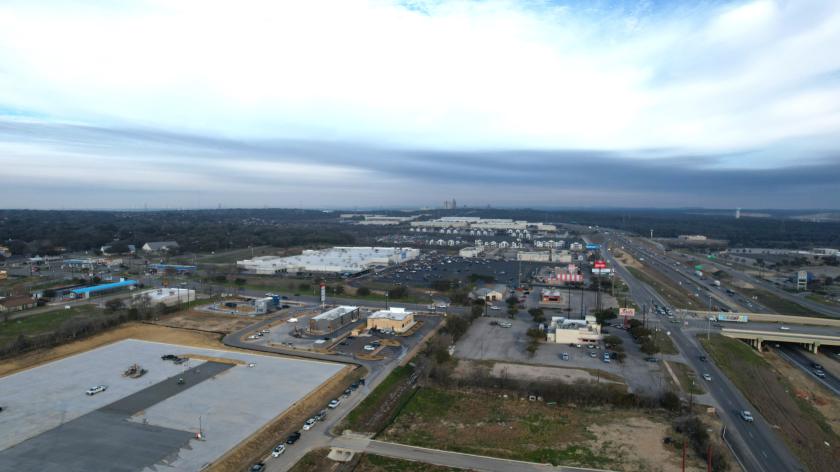
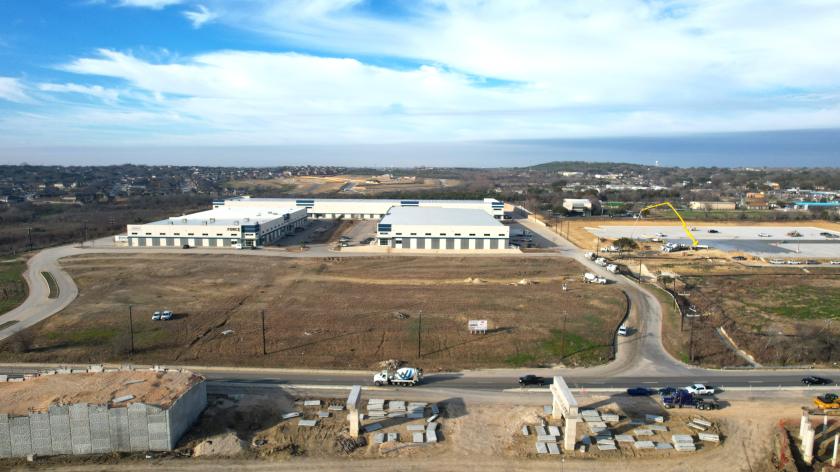
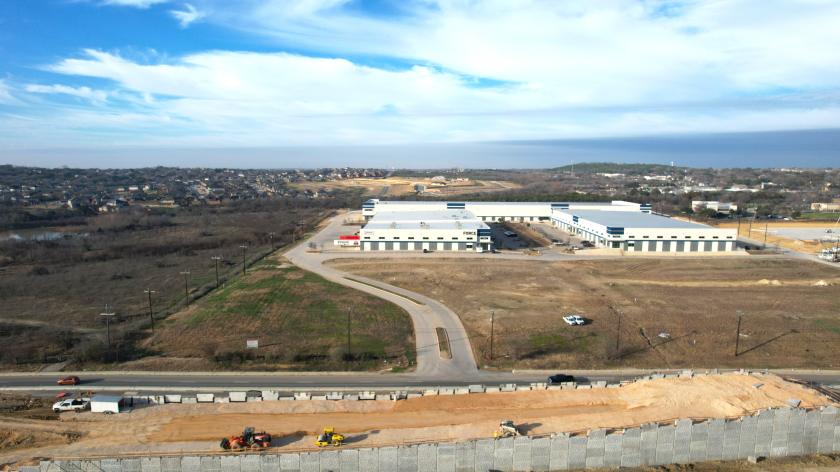
Additional Photos
Listing Agents

Amanda Powell
O: 210-222-2424
M: 281-733-9545
anelson@dhrp.us
O: 210-222-2424
M: 281-733-9545
anelson@dhrp.us
While we strive to provide the most accurate information, all listing information, and demographic data, is provided by third-parties. As such, MyEListing will not be responsible for the accuracy of the information. It is strongly recommended that you verify all information with the listing agent, and any relevant agencies, prior to making any decisions.