Office Space
4800 East 57th Street Sioux Falls, SD 57108
4800 East 57th Street Sioux Falls, SD 57108

Details & Description
Property Highlights
- • One-of-a-kind office buildout!
- • 480 sq. ft. garage
- • Monument signage
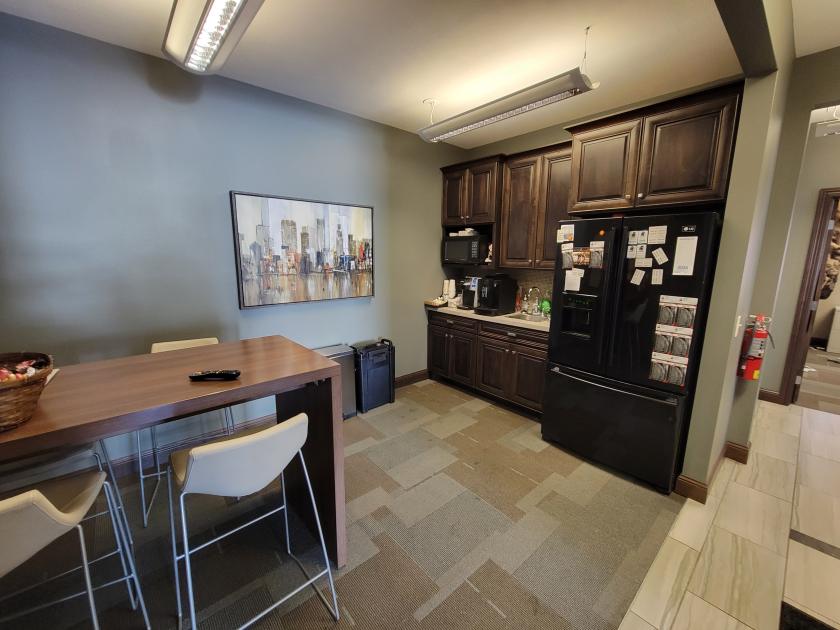
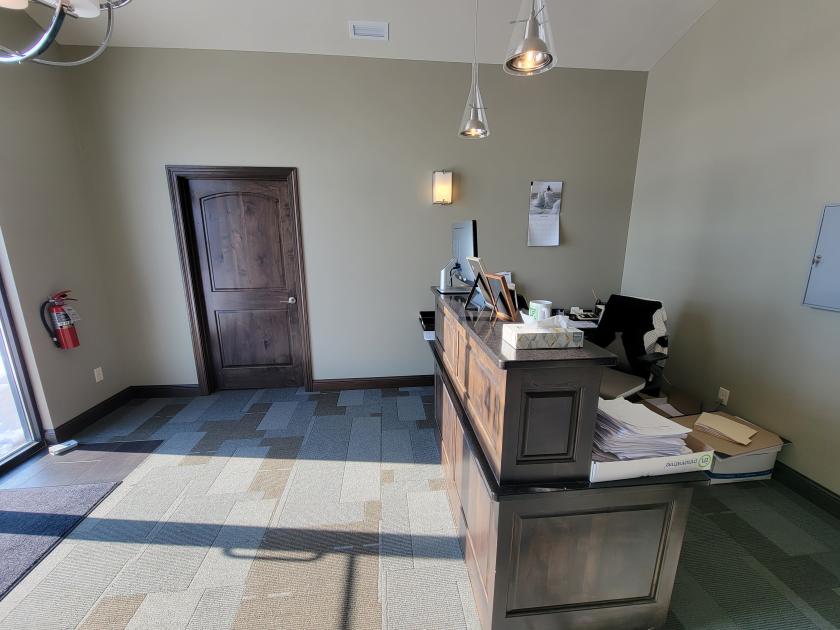
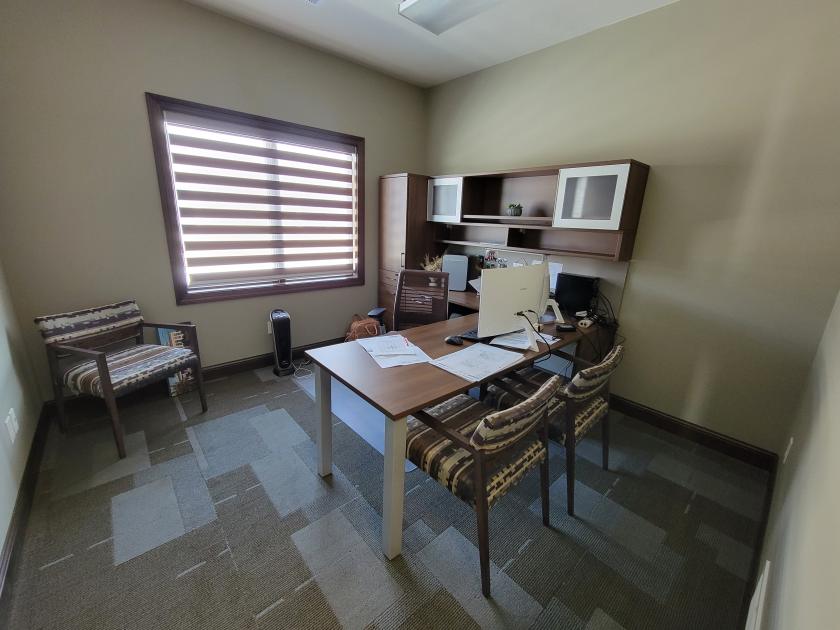
Additional Photos


Listing Agents

Troy Fawcett
O: 605-357-7100
M: 605-321-2199
tfawcett@naisiouxfalls.com
O: 605-357-7100
M: 605-321-2199
tfawcett@naisiouxfalls.com
While we strive to provide the most accurate information, all listing information, and demographic data, is provided by third-parties. As such, MyEListing will not be responsible for the accuracy of the information. It is strongly recommended that you verify all information with the listing agent, and any relevant agencies, prior to making any decisions.