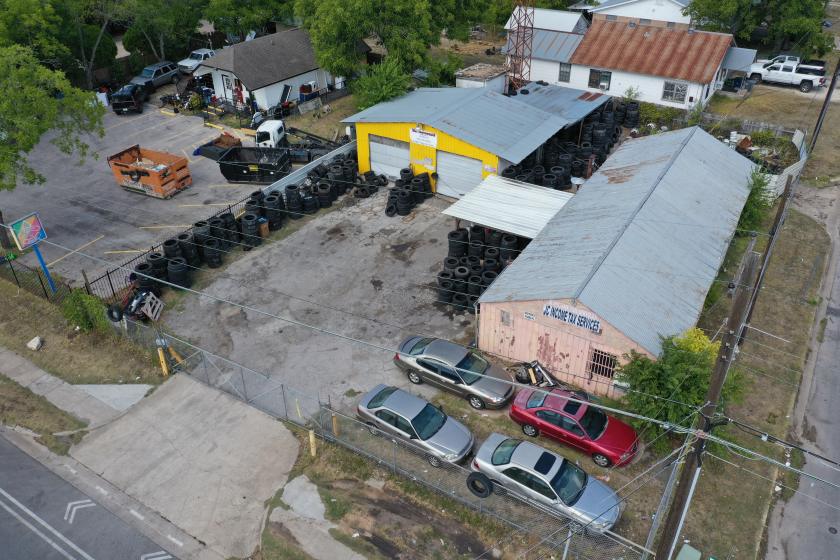
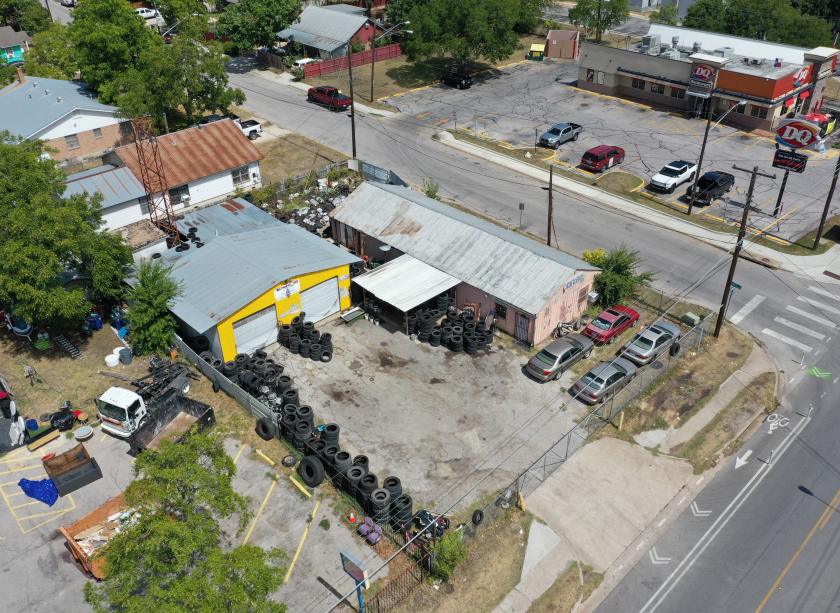
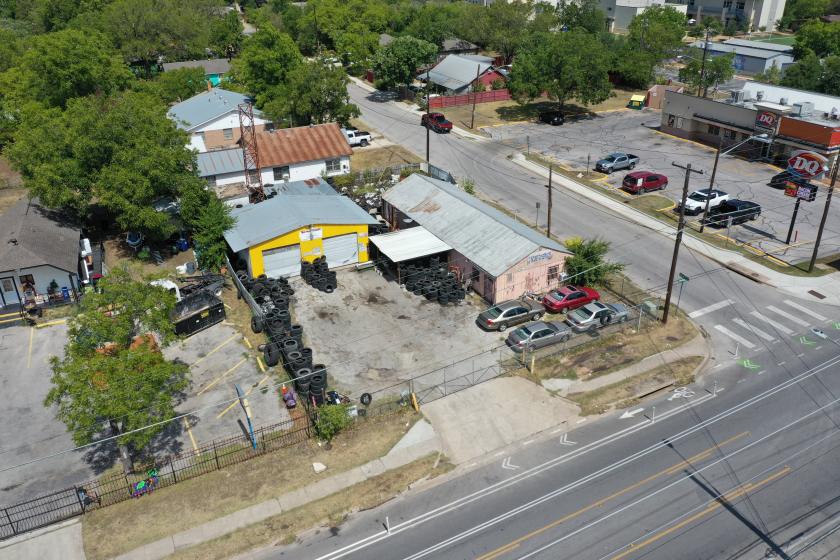
1-Mile | 3-Miles | 5-Miles | ||
---|---|---|---|---|
Total Population | 17,884 | 112,505 | 300,343 | |
Population Median Age | 35 | 34 | 34 | |
Population by Age | 0-9 Yrs | 3166 (17%) | 14905 (13%) | 33641 (11%) |
10-19 Yrs | 1636 (9%) | 10761 (9%) | 38746 (12%) | |
20-29 Yrs | 2203 (12%) | 23248 (20%) | 68395 (22%) | |
30-39 Yrs | 3969 (22%) | 23932 (21%) | 59350 (19%) | |
40-49 Yrs | 2554 (14%) | 14553 (12%) | 37349 (12%) | |
50-59 Yrs | 1730 (9%) | 10778 (9%) | 27090 (9%) | |
60-69 Yrs | 1326 (7%) | 7825 (6%) | 20130 (6%) | |
70+ Yrs | 1300 (7%) | 6502 (5%) | 15640 (5%) | |
Median HH Income | $76,165 | $59,670 | $61,818 | |
Total Household Income | < 24K | 1096 (18%) | 9253 (21%) | 24925 (21%) |
25-49K | 1089 (17%) | 9706 (22%) | 23013 (20%) | |
50-74K | 820 (13%) | 7111 (16%) | 17646 (15%) | |
75-99K | 792 (13%) | 4846 (11%) | 13101 (11%) | |
100-199K | 1692 (27%) | 9604 (21%) | 26082 (22%) | |
200K+ | 595 (9%) | 3231 (7%) | 9949 (8%) | |
Highest Education Level | No Diploma | 2177 | 12542 | 29701 |
Diploma or GED | 2183 | 14784 | 33605 | |
Some College | 2213 | 12854 | 31073 | |
Assoc. Degree | 649 | 3084 | 8170 | |
Bachelors Degree | 3212 | 22000 | 56297 | |
Higher Degree | 2075 | 13559 | 36486 | |
Total Housing Units | 6,593 | 47,578 | 126,283 | |
--Owner-Occupied | 3,481 | 17,632 | 45,228 | |
--Renter-Occupied | 2,601 | 26,119 | 69,488 | |
Owner-Occupied Values | < 100K | 93 | 1546 | 3121 |
100-199K | 176 | 1837 | 5302 | |
200-299K | 704 | 3236 | 8526 | |
300-399K | 1382 | 4726 | 8888 | |
400-499K | 766 | 2951 | 7440 | |
500K+ | 360 | 3335 | 11950 | |
Total Working Age Population | 13,713 | 90,461 | 249,203 | |
In Work Force | 10,187 | 67,593 | 175,177 | |
Not In Work Force | 3,526 | 22,868 | 74,026 | |
Workforce Employed | 9,743 | 64,594 | 166,854 | |
Workforce Unemployed | 427 | 2,918 | 8,218 | |
Civlian Workforce | 10,170 | 67,512 | 175,072 | |
Military Workforce | 17 | 81 | 106 | |
Total Households | 6,082 | 43,751 | 114,716 | |
Family Households | 3,754 | 22,280 | 53,830 | |
Non-Family Households | 2,329 | 21,471 | 60,886 | |
Married Couple | 2,478 | 13,708 | 35,810 | |
Other Family | 1,276 | 8,572 | 18,020 | |
Married w/Child | 1,039 | 5,770 | 15,842 | |
Single Male w/Child | 86 | 882 | 1,941 | |
Single Female w/Child | 627 | 3,462 | 7,099 |
Population Change Last Two Decades - Plus Projection
2000 | % | 2010 | % | 2020 | % | 2030 | |
---|---|---|---|---|---|---|---|
Texas | 20,851,820 | +21 | 25,145,561 | +18 | 29,677,668 | +18 | 34,894,452 |
Travis County | 812,280 | +26 | 1,024,266 | +26 | 1,291,502 | +19 | 1,540,812 |
Total Working Age Population:
Total Households:
Total Working Age Population:
Total Households:
Total Working Age Population:
Total Households: