Retail Space
8126 Gravois Road St Louis, MO 63123
8126 Gravois Road St Louis, MO 63123

Details & Description
Property Highlights
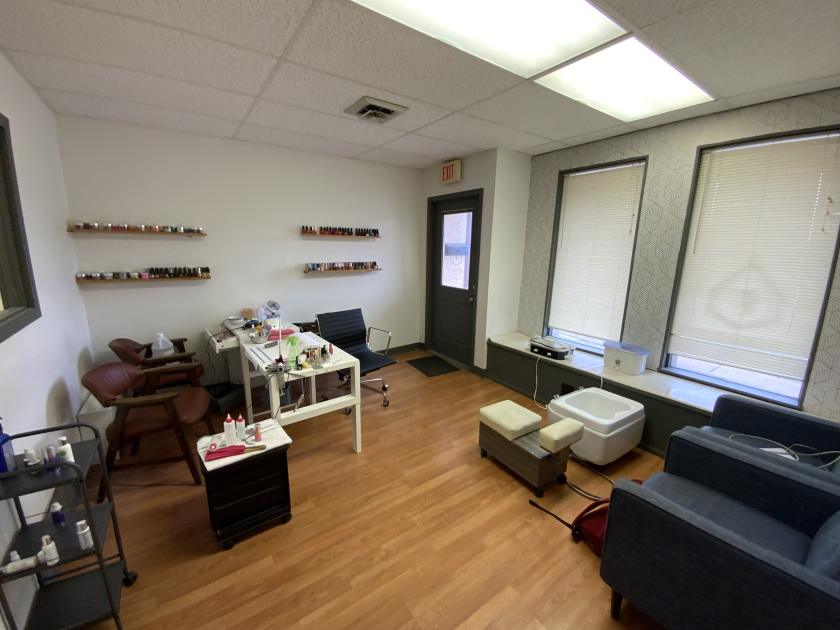
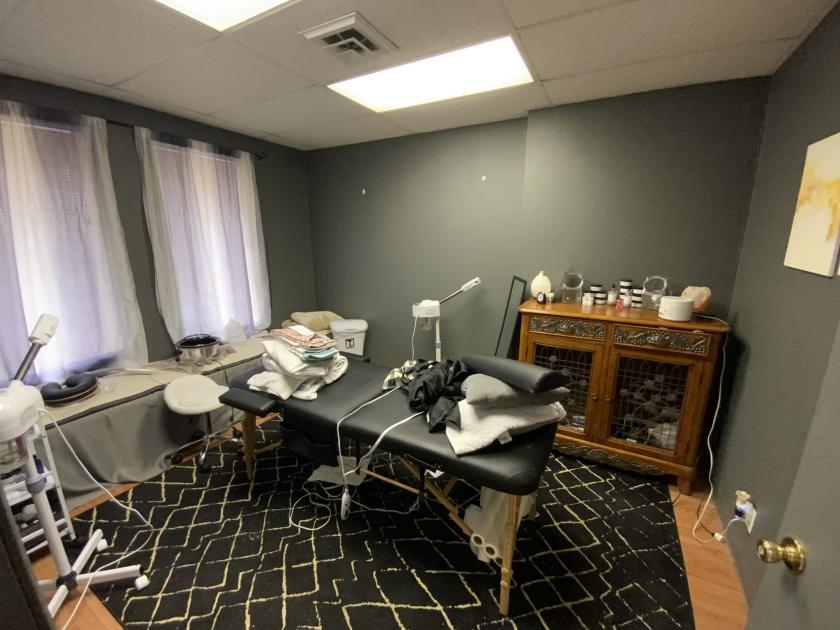
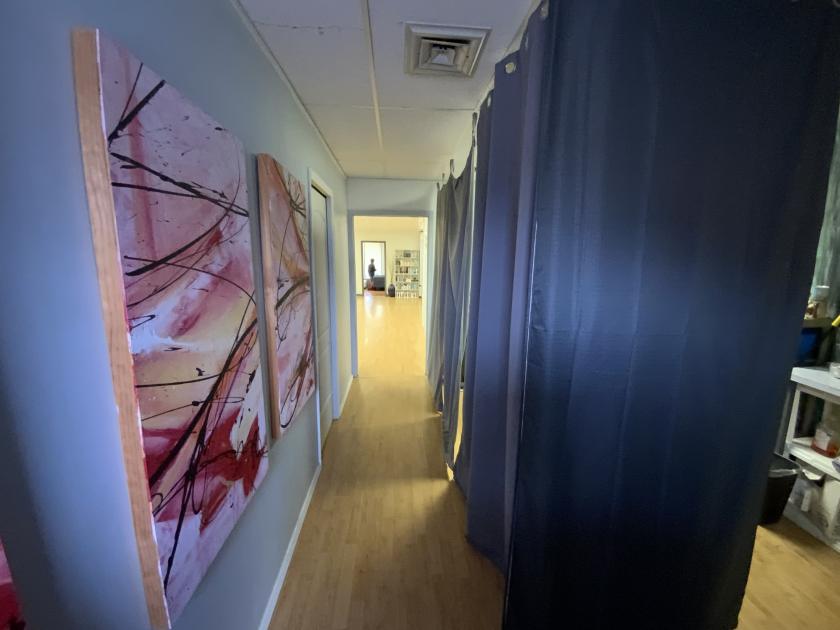
- • 1300 SF Beauty Salon/Spa
- • Great Gravois Location
- • Only Minutes away from I-55
- • At Signalized Intersection
Additional Photos


Listing Agents

Hal Hanstein
O: 636-225-0385
M: 314-607-2928
hal@cardinalrealtygroup.com
O: 636-225-0385
M: 314-607-2928
hal@cardinalrealtygroup.com
While we strive to provide the most accurate information, all listing information, and demographic data, is provided by third-parties. As such, MyEListing will not be responsible for the accuracy of the information. It is strongly recommended that you verify all information with the listing agent, and any relevant agencies, prior to making any decisions.