Retail Space
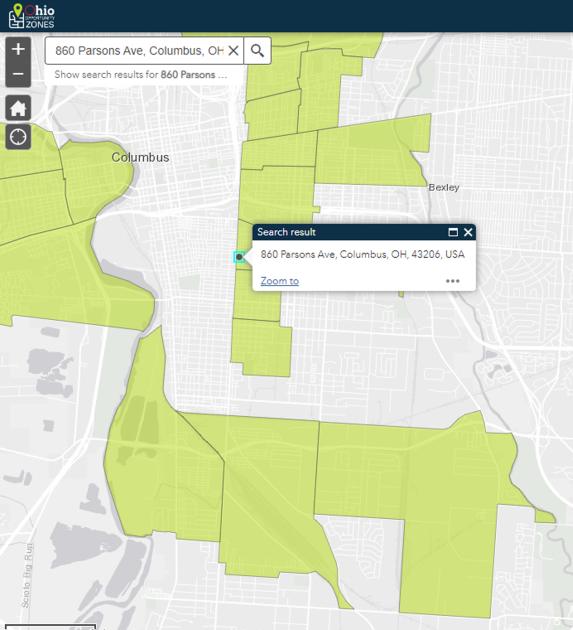
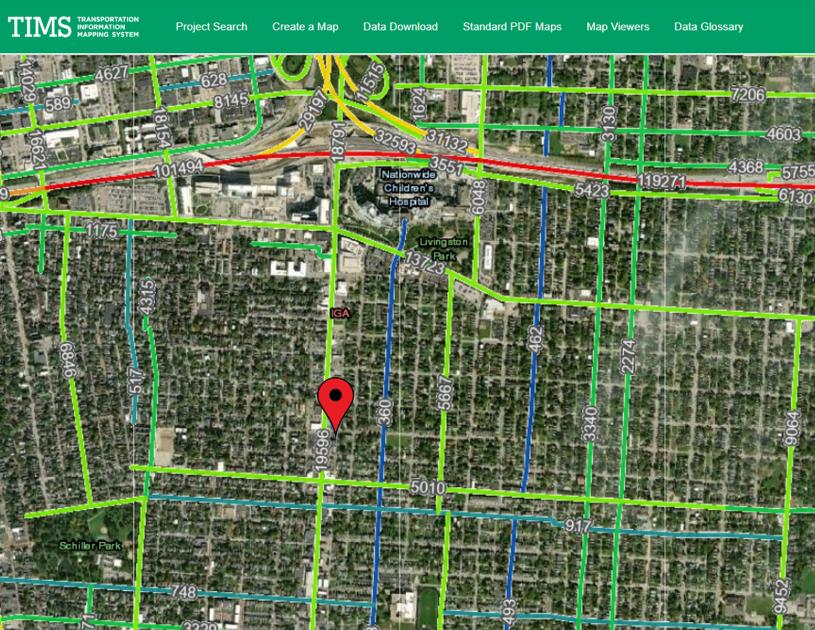
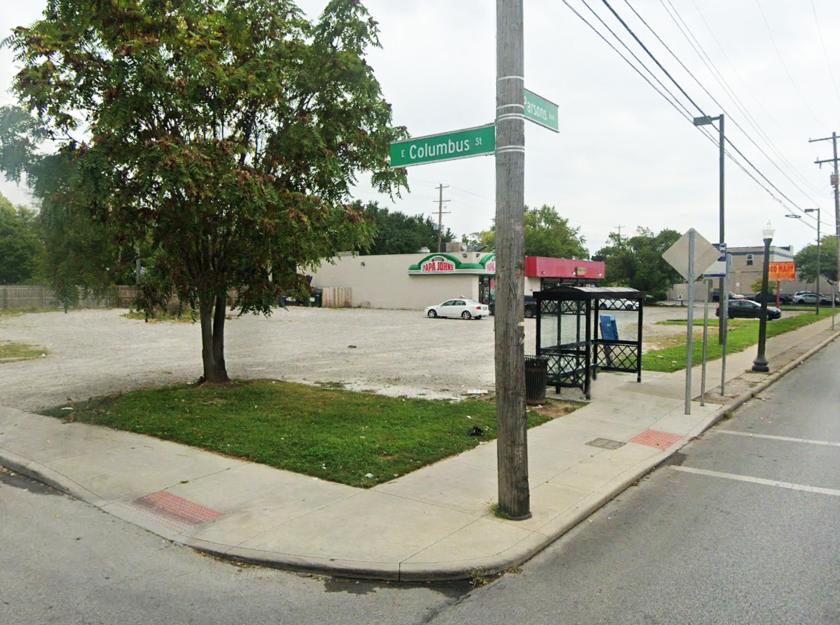
860-870 Parsons Avenue Columbus, OH 43206
860-870 Parsons Avenue Columbus, OH 43206

Details & Description
Property Highlights
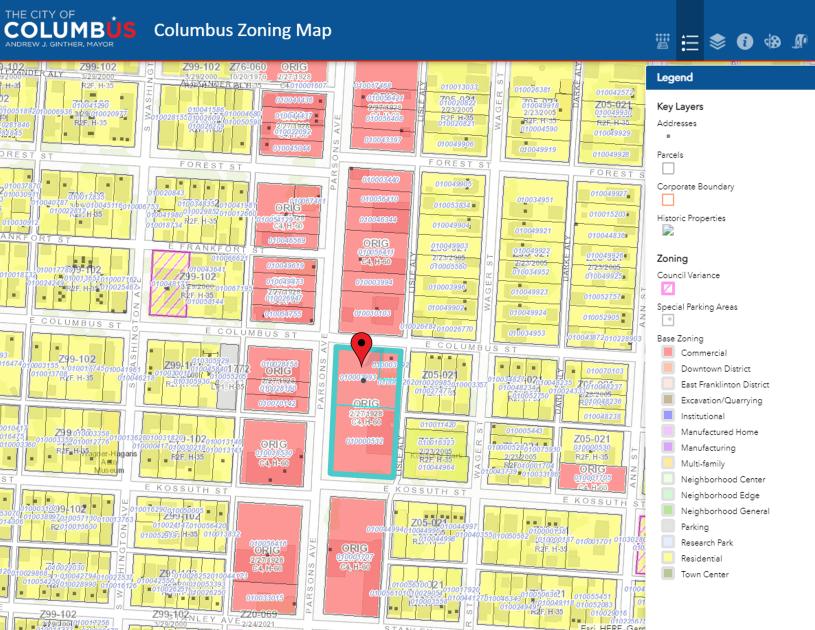
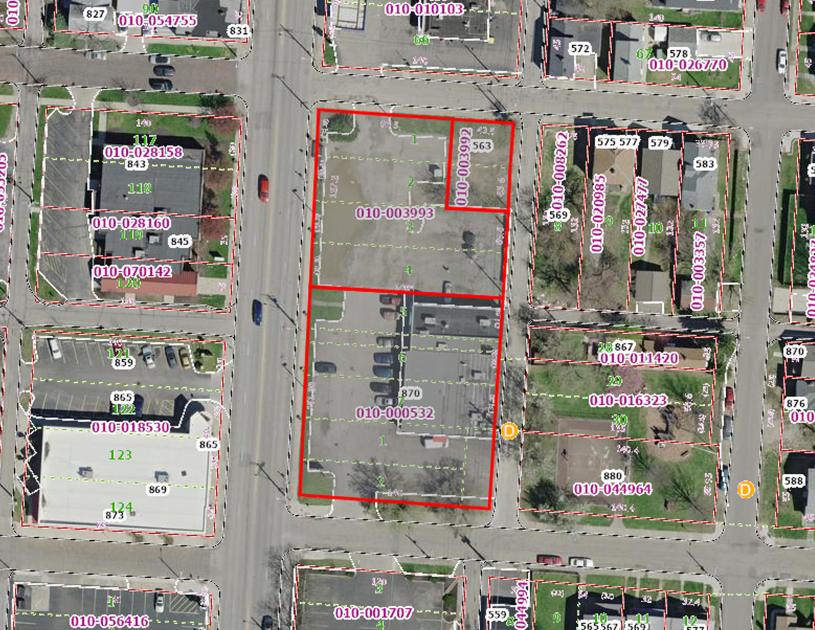
• Potential for a large mixed-use project or a build to suit
• The current tenants in place have short-term leases
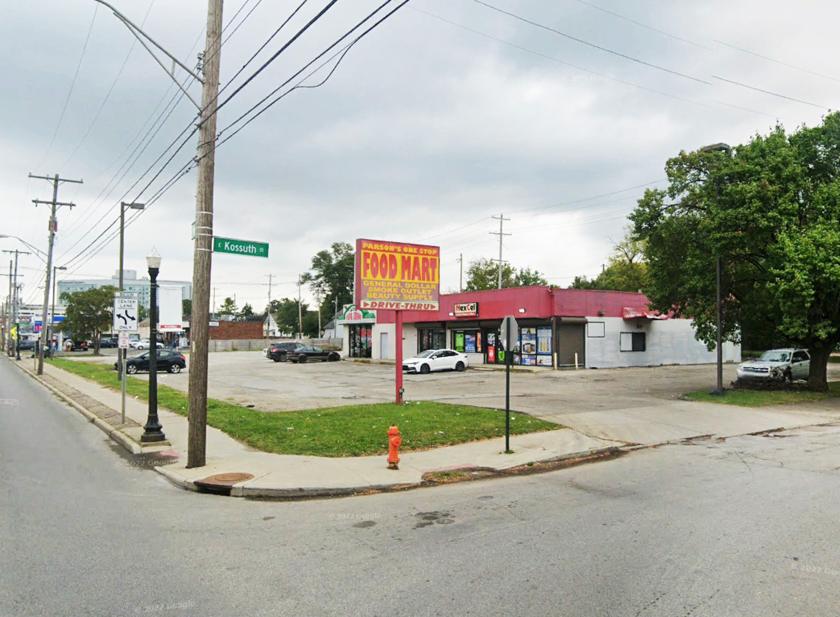
Additional Photos

Listing Agents

Alex Marsh
O: 614-245-2182
M: 614-937-3658
amarsh@rweiler.com
O: 614-245-2182
M: 614-937-3658
amarsh@rweiler.com
While we strive to provide the most accurate information, all listing information, and demographic data, is provided by third-parties. As such, MyEListing will not be responsible for the accuracy of the information. It is strongly recommended that you verify all information with the listing agent, and any relevant agencies, prior to making any decisions.