Flex-Office-Warehouse
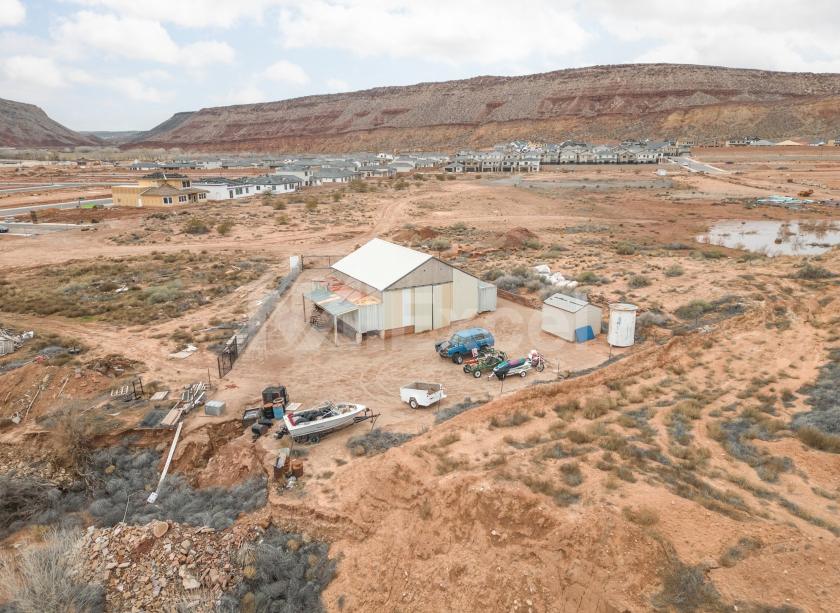
3095 E Washington Dam Rd Washington, UT 84780
3095 E Washington Dam Rd Washington, UT 84780
Details & Description
Property Highlights
- • owner will sell or trade
- • Located near Washington Dam Rd
- • 2000 SF Building
Listing Agents

Wes Davis
NAI Excel
O: 435-627-5705
wdavis@naiexcel.com
NAI Excel
O: 435-627-5705
wdavis@naiexcel.com
While we strive to provide the most accurate information, all listing information, and demographic data, is provided by third-parties. As such, MyEListing will not be responsible for the accuracy of the information. It is strongly recommended that you verify all information with the listing agent, and any relevant agencies, prior to making any decisions.

