Commercial Land
1540 Longneck Rd Princeton, TX 75407
1540 Longneck Rd Princeton, TX 75407
Details & Description
Property Highlights
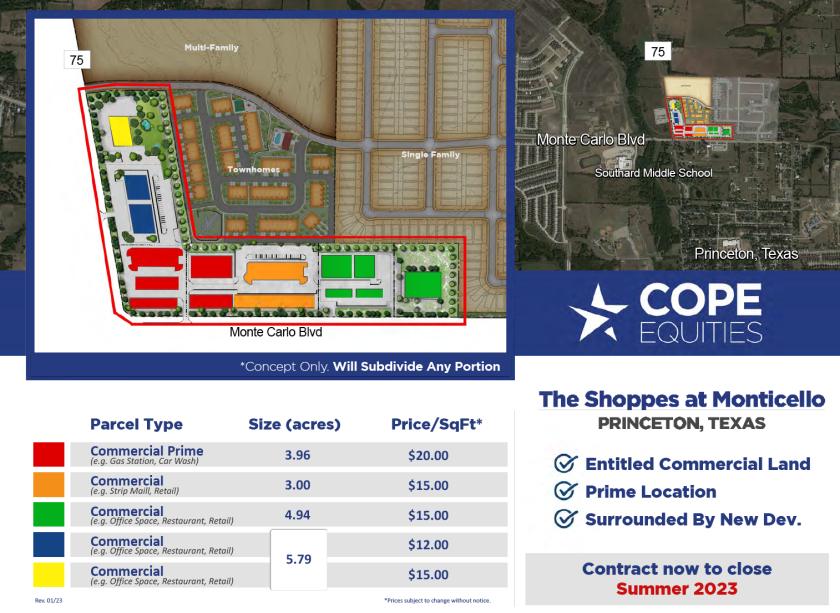
- • Pad Sites Available Starting at 1.2 AC
- • Hard Corner Available for Gas Station
- • Multi-Million Dollar Car Wash Planned
- • Access to Water, Sewer and Electrical
Additional Photos


Listing Agents

David Dunn
O: 817-640-9964
M: 817-829-2828
david.dunn@svn.com
O: 817-640-9964
M: 817-829-2828
david.dunn@svn.com
While we strive to provide the most accurate information, all listing information, and demographic data, is provided by third-parties. As such, MyEListing will not be responsible for the accuracy of the information. It is strongly recommended that you verify all information with the listing agent, and any relevant agencies, prior to making any decisions.


