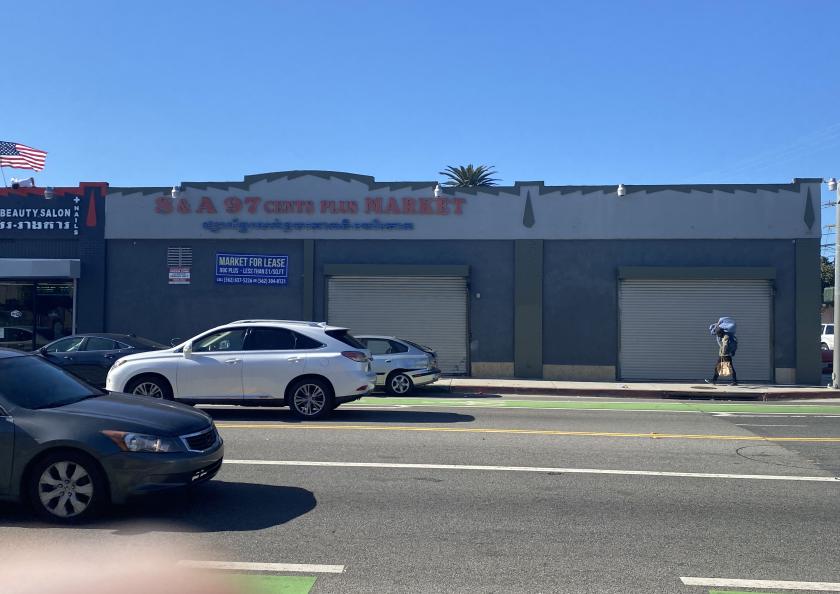
1-Mile | 3-Miles | 5-Miles | ||
---|---|---|---|---|
Total Population | 72,337 | 270,952 | 463,863 | |
Population Median Age | 33 | 36 | 37 | |
Population by Age | 0-9 Yrs | 10721 (14%) | 31100 (11%) | 54942 (11%) |
10-19 Yrs | 10765 (14%) | 31843 (11%) | 56515 (12%) | |
20-29 Yrs | 13329 (18%) | 49923 (18%) | 77636 (16%) | |
30-39 Yrs | 11379 (15%) | 46512 (17%) | 72770 (15%) | |
40-49 Yrs | 8944 (12%) | 35838 (13%) | 60481 (13%) | |
50-59 Yrs | 8503 (11%) | 33933 (12%) | 59340 (12%) | |
60-69 Yrs | 5630 (7%) | 24950 (9%) | 46672 (10%) | |
70+ Yrs | 3066 (4%) | 16855 (6%) | 35506 (7%) | |
Median HH Income | $46,403 | $60,835 | $69,021 | |
Total Household Income | < 24K | 5434 (24%) | 20625 (20%) | 29482 (17%) |
25-49K | 6382 (29%) | 21746 (21%) | 32758 (19%) | |
50-74K | 4276 (19%) | 18567 (18%) | 28035 (16%) | |
75-99K | 2270 (10%) | 13641 (13%) | 23297 (13%) | |
100-199K | 2808 (12%) | 21848 (21%) | 40299 (23%) | |
200K+ | 623 (2%) | 6457 (6%) | 14570 (8%) | |
Highest Education Level | No Diploma | 17455 | 40891 | 60455 |
Diploma or GED | 8868 | 30853 | 55557 | |
Some College | 9692 | 42989 | 74417 | |
Assoc. Degree | 2108 | 12669 | 23644 | |
Bachelors Degree | 4996 | 38703 | 67461 | |
Higher Degree | 1593 | 20256 | 36625 | |
Total Housing Units | 23,119 | 109,998 | 178,223 | |
--Owner-Occupied | 4,269 | 29,753 | 68,962 | |
--Renter-Occupied | 17,524 | 73,131 | 99,478 | |
Owner-Occupied Values | < 100K | 61 | 494 | 1876 |
100-199K | 71 | 436 | 1122 | |
200-299K | 556 | 1856 | 3113 | |
300-399K | 1053 | 4895 | 7842 | |
400-499K | 1074 | 5473 | 10494 | |
500K+ | 1454 | 16600 | 44515 | |
Total Working Age Population | 54,786 | 220,661 | 375,406 | |
In Work Force | 35,124 | 150,470 | 249,742 | |
Not In Work Force | 19,662 | 70,191 | 125,664 | |
Workforce Employed | 31,992 | 139,964 | 233,571 | |
Workforce Unemployed | 3,013 | 10,196 | 15,763 | |
Civlian Workforce | 35,005 | 150,161 | 249,335 | |
Military Workforce | 119 | 310 | 407 | |
Total Households | 21,794 | 102,884 | 168,440 | |
Family Households | 14,906 | 55,013 | 100,152 | |
Non-Family Households | 6,887 | 47,871 | 68,288 | |
Married Couple | 7,255 | 32,985 | 64,476 | |
Other Family | 7,651 | 22,028 | 35,676 | |
Married w/Child | 3,809 | 13,592 | 26,567 | |
Single Male w/Child | 1,286 | 3,373 | 4,919 | |
Single Female w/Child | 2,796 | 7,675 | 12,042 |
Population Change Last Two Decades - Plus Projection
2000 | % | 2010 | % | 2020 | % | 2030 | |
---|---|---|---|---|---|---|---|
California | 33,871,648 | +10 | 37,253,956 | +9 | 40,467,295 | +8 | 43,631,295 |
Los Angeles County | 9,519,338 | +3 | 9,818,605 | +6 | 10,369,367 | +4 | 10,759,850 |
Orange County | 2,846,289 | +6 | 3,010,232 | +8 | 3,257,087 | +5 | 3,431,096 |
Total Working Age Population:
Total Households:
Total Working Age Population:
Total Households:
Total Working Age Population:
Total Households: