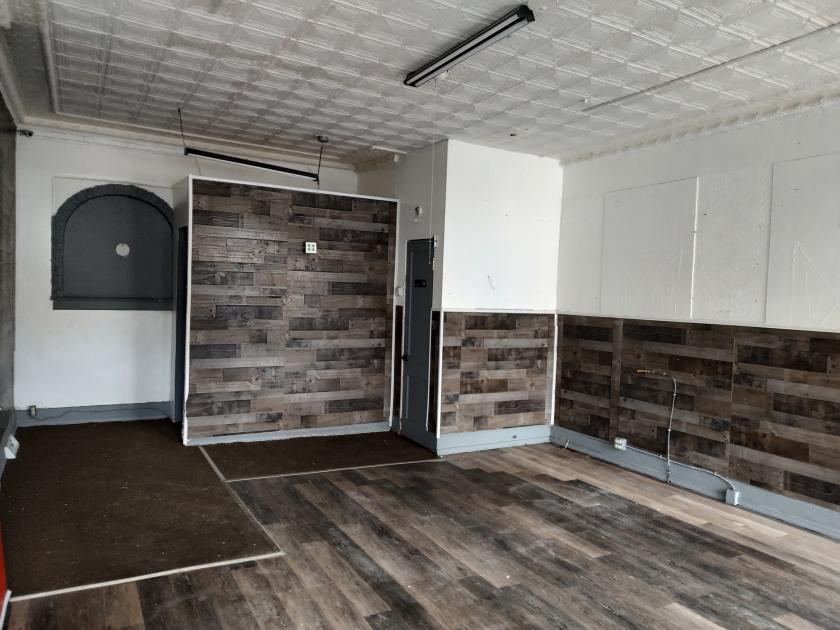
1-Mile | 3-Miles | 5-Miles | ||
---|---|---|---|---|
Total Population | 34,654 | 117,111 | 268,136 | |
Population Median Age | 36 | 36 | 37 | |
Population by Age | 0-9 Yrs | 3817 (11%) | 14653 (12%) | 34403 (12%) |
10-19 Yrs | 3793 (10%) | 14631 (12%) | 33426 (12%) | |
20-29 Yrs | 7883 (22%) | 24598 (21%) | 49429 (18%) | |
30-39 Yrs | 5764 (16%) | 16786 (14%) | 38951 (14%) | |
40-49 Yrs | 4166 (12%) | 11920 (10%) | 29597 (11%) | |
50-59 Yrs | 3407 (9%) | 12757 (10%) | 31098 (11%) | |
60-69 Yrs | 3363 (9%) | 11985 (10%) | 28353 (10%) | |
70+ Yrs | 2461 (7%) | 9781 (8%) | 22878 (8%) | |
Median HH Income | $42,199 | $38,062 | $40,366 | |
Total Household Income | < 24K | 5245 (31%) | 19131 (36%) | 39753 (33%) |
25-49K | 4176 (25%) | 12534 (24%) | 28711 (24%) | |
50-74K | 2586 (15%) | 7631 (14%) | 18888 (16%) | |
75-99K | 1522 (9%) | 4626 (8%) | 11354 (9%) | |
100-199K | 2461 (14%) | 6149 (11%) | 15327 (12%) | |
200K+ | 635 (3%) | 2041 (3%) | 3874 (3%) | |
Highest Education Level | No Diploma | 3537 | 11701 | 24109 |
Diploma or GED | 5033 | 18490 | 47820 | |
Some College | 3793 | 14484 | 34683 | |
Assoc. Degree | 1609 | 6788 | 17007 | |
Bachelors Degree | 5145 | 13357 | 30499 | |
Higher Degree | 4852 | 12104 | 23447 | |
Total Housing Units | 19,758 | 63,239 | 138,268 | |
--Owner-Occupied | 5,064 | 18,065 | 51,820 | |
--Renter-Occupied | 11,561 | 34,046 | 66,088 | |
Owner-Occupied Values | < 100K | 960 | 7373 | 22962 |
100-199K | 1349 | 4049 | 16527 | |
200-299K | 1373 | 2768 | 6118 | |
300-399K | 556 | 1417 | 2691 | |
400-499K | 369 | 935 | 1186 | |
500K+ | 457 | 1523 | 2336 | |
Total Working Age Population | 28,449 | 95,077 | 215,332 | |
In Work Force | 18,914 | 56,661 | 129,796 | |
Not In Work Force | 9,535 | 38,416 | 85,536 | |
Workforce Employed | 18,036 | 52,556 | 120,524 | |
Workforce Unemployed | 854 | 4,044 | 9,042 | |
Civlian Workforce | 18,891 | 56,600 | 129,566 | |
Military Workforce | 23 | 61 | 231 | |
Total Households | 16,625 | 52,112 | 117,908 | |
Family Households | 6,010 | 22,584 | 58,490 | |
Non-Family Households | 10,615 | 29,527 | 59,418 | |
Married Couple | 3,417 | 11,217 | 29,511 | |
Other Family | 2,594 | 11,367 | 28,979 | |
Married w/Child | 1,726 | 4,903 | 11,574 | |
Single Male w/Child | 347 | 1,037 | 2,673 | |
Single Female w/Child | 1,102 | 5,086 | 12,786 |
Population Change Last Two Decades - Plus Projection
2000 | % | 2010 | % | 2020 | % | 2030 | |
---|---|---|---|---|---|---|---|
New York | 18,976,457 | +2 | 19,378,102 | +4 | 20,146,131 | +2 | 20,604,030 |
Erie County | 950,265 | -3 | 919,040 | +2 | 936,084 | +1 | 949,073 |
Total Working Age Population:
Total Households:
Total Working Age Population:
Total Households:
Total Working Age Population:
Total Households: