Industrial Properties
1 Old Wire Road West Columbia, SC 29172
1 Old Wire Road West Columbia, SC 29172
Details & Description
Property Highlights
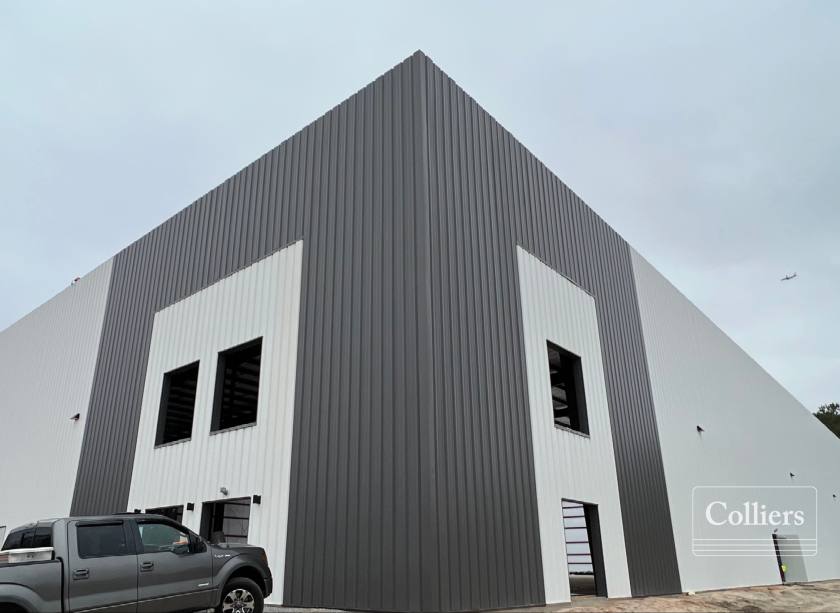
- • Building dimensions: 250’ x 175’
- • Construction: Pre-engineered metal
- • Roof: Standing seam metal
- • Floors: 6” concrete slab, 4,000 PSI
- • Clear height: 28’
- • Column spacing: 25’ - 58’
Listing Agents

Chuck Salley
O: 803-401-4266
M: 803-463-4843
Chuck.Salley@colliers.com
O: 803-401-4266
M: 803-463-4843
Chuck.Salley@colliers.com
While we strive to provide the most accurate information, all listing information, and demographic data, is provided by third-parties. As such, MyEListing will not be responsible for the accuracy of the information. It is strongly recommended that you verify all information with the listing agent, and any relevant agencies, prior to making any decisions.


