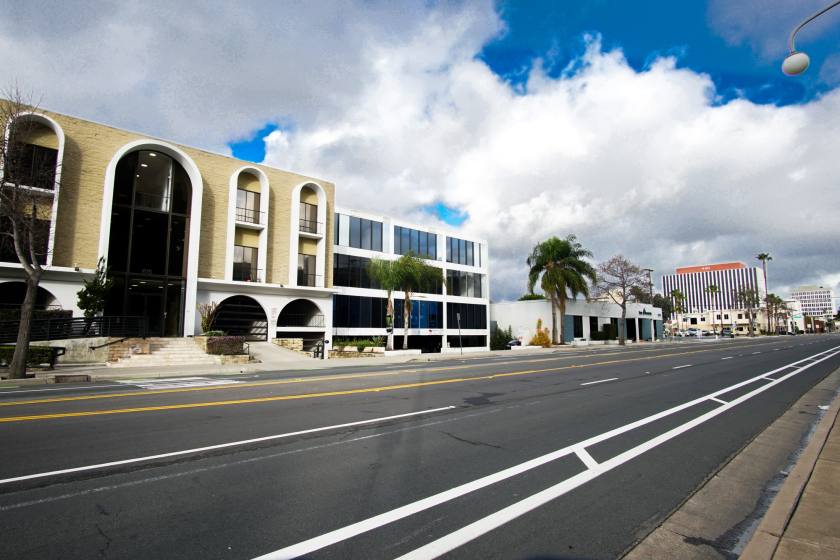
Office Space
611 West Civic Center Drive Santa Ana, CA 92701
611 West Civic Center Drive Santa Ana, CA 92701

Details & Description
Property Highlights
- • Fiber-optic cable
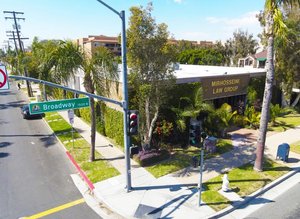
- • Directly across from the OC Court House
- • Elevator served
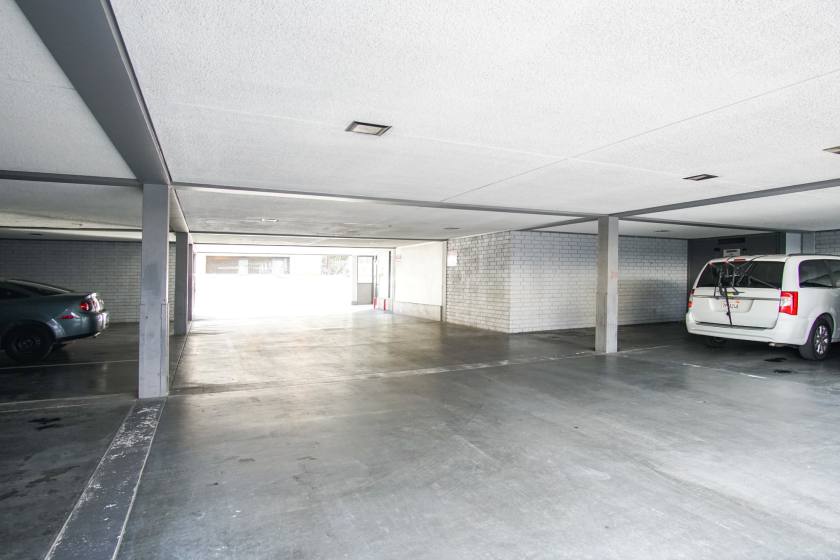
- • Covered parking
- • Owner will modify for the right tenant
- • Private roof top patio
Additional Photos


Listing Agents

Fernando Crisantos
O: 949-558-0312
M: 714-604-5175
f.crisantos@svn.com
O: 949-558-0312
M: 714-604-5175
f.crisantos@svn.com
While we strive to provide the most accurate information, all listing information, and demographic data, is provided by third-parties. As such, MyEListing will not be responsible for the accuracy of the information. It is strongly recommended that you verify all information with the listing agent, and any relevant agencies, prior to making any decisions.