Commercial Land
4848 Coconut Creek Parkway Coconut Creek, FL 33063
4848 Coconut Creek Parkway Coconut Creek, FL 33063

Details & Description
Property Highlights
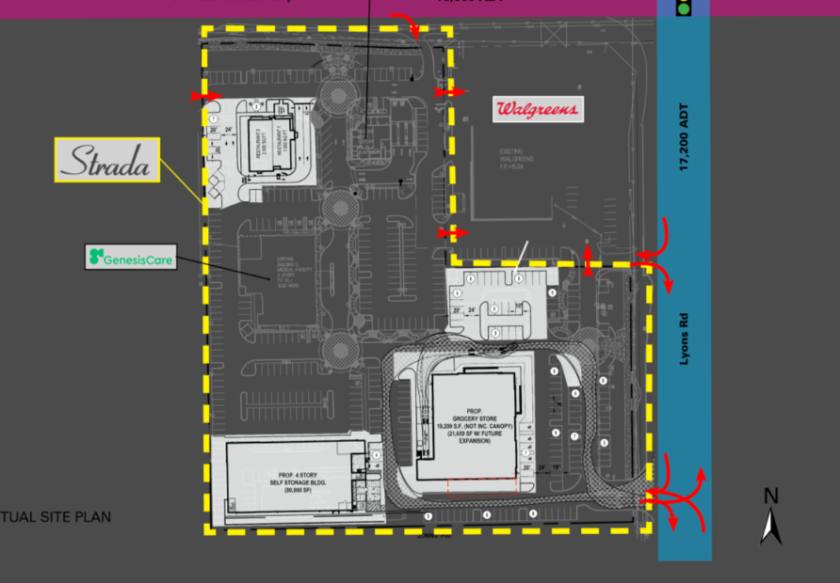
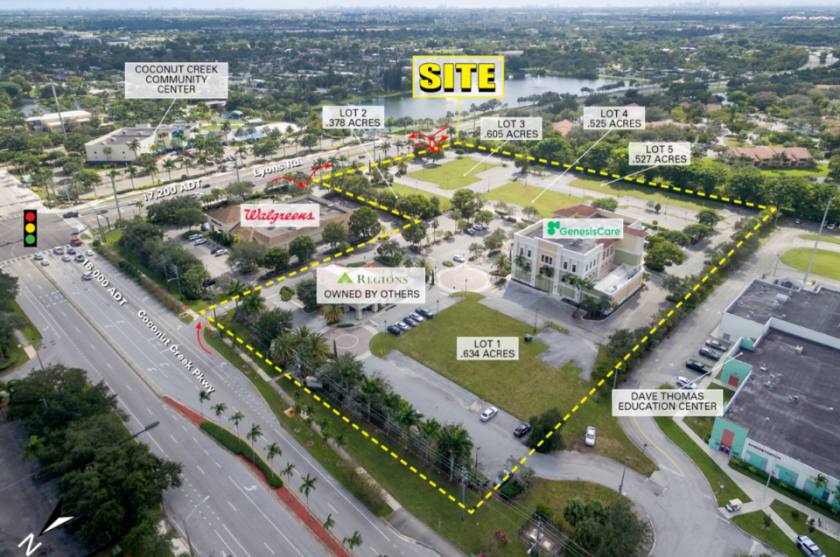
• Located across from high volume Publix anchored shopping center, Broward College, and Atlantic Technical College
• Signalized corner location with 33,200 cars per day, excellent visibility, and full access from both roads
Additional Photos

Listing Agents

Travis Langhorst
O: 561-424-3026
tlanghorst@atlanticretail.com
O: 561-424-3026
tlanghorst@atlanticretail.com
While we strive to provide the most accurate information, all listing information, and demographic data, is provided by third-parties. As such, MyEListing will not be responsible for the accuracy of the information. It is strongly recommended that you verify all information with the listing agent, and any relevant agencies, prior to making any decisions.