Industrial Properties
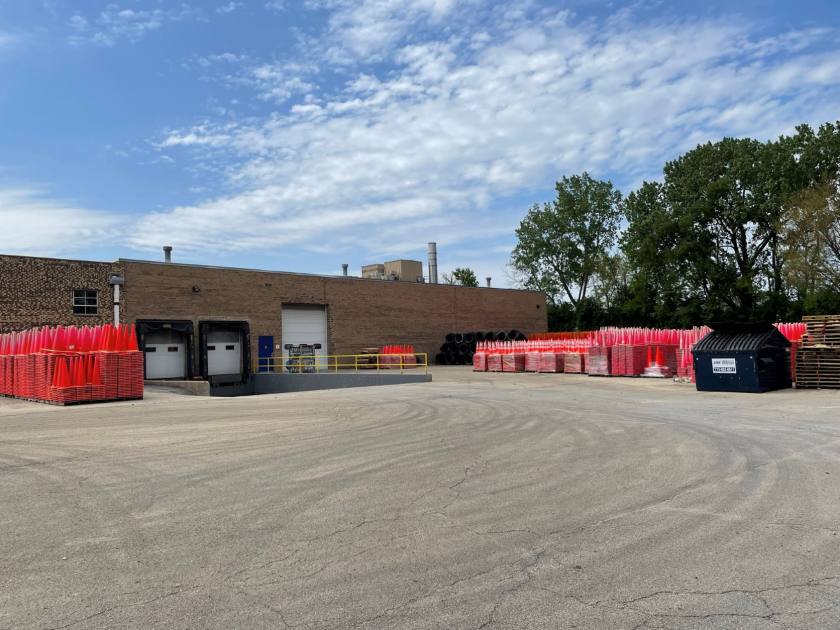
2500 Production Drive St Charles, IL 60174
2500 Production Drive St Charles, IL 60174

Details & Description
Property Highlights
- • Heavy Power
- • 7 docks & 1 drive-in door
- • Outdoor Storage Allowed
Additional Photos


Listing Agents

Brian Lindgren
O: 630-938-4950
M: 630-487-9433
brian.lindgren@svn.com
O: 630-938-4950
M: 630-487-9433
brian.lindgren@svn.com
While we strive to provide the most accurate information, all listing information, and demographic data, is provided by third-parties. As such, MyEListing will not be responsible for the accuracy of the information. It is strongly recommended that you verify all information with the listing agent, and any relevant agencies, prior to making any decisions.


