Flex-Office-Warehouse
501 North 8th Street Medford, WI 54451
501 North 8th Street Medford, WI 54451

Details & Description
Property Highlights
- • Located in the heart of Medford
- • Ample parking
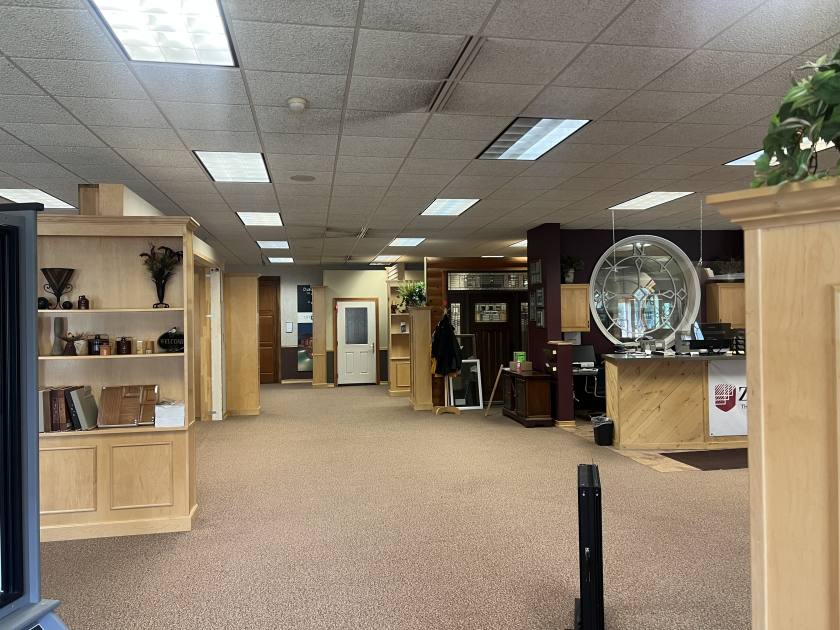
- • Nice storefront
- • Updated interior
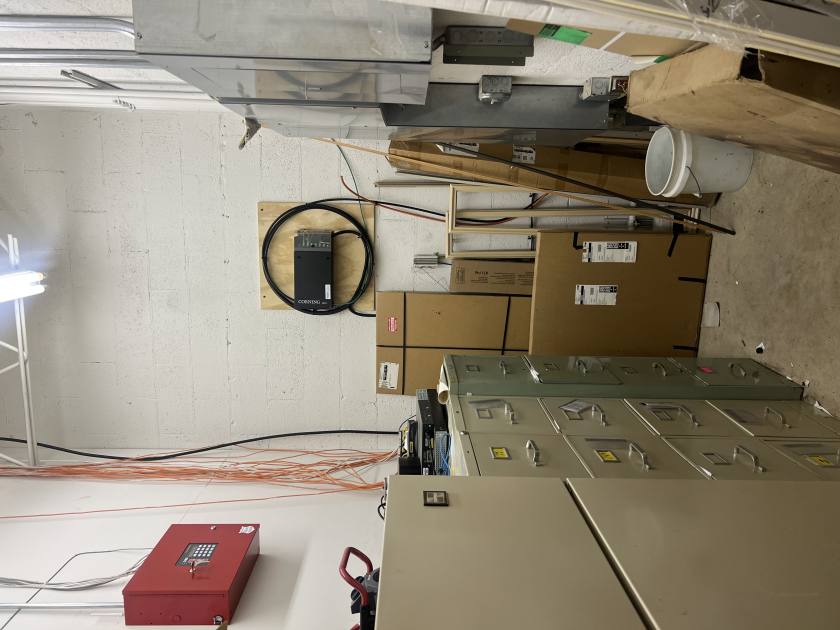
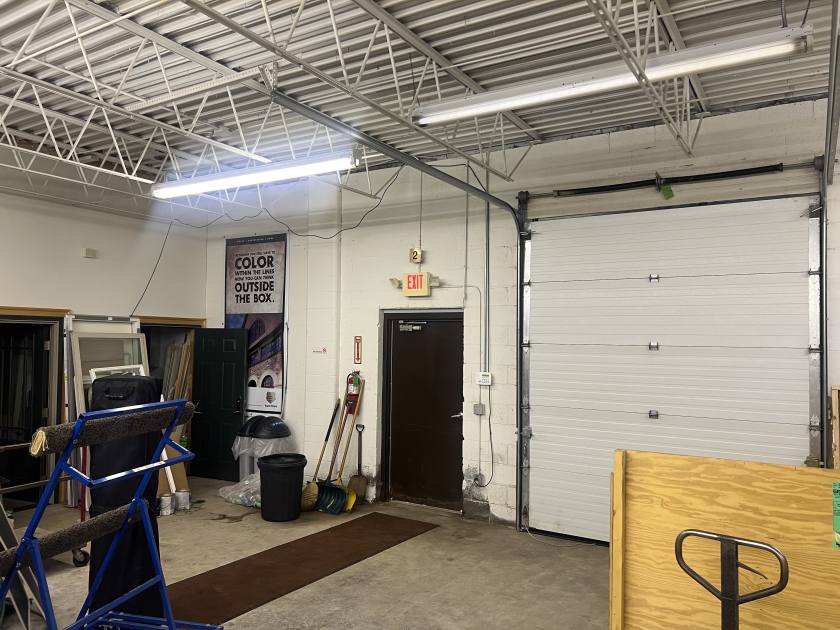
- • Plenty of warhouse storage
- • Solid constructed building
Additional Photos


Listing Agents

TJ Morice
O: 715-218-2900
tjm@naipfefferle.com
O: 715-218-2900
tjm@naipfefferle.com
While we strive to provide the most accurate information, all listing information, and demographic data, is provided by third-parties. As such, MyEListing will not be responsible for the accuracy of the information. It is strongly recommended that you verify all information with the listing agent, and any relevant agencies, prior to making any decisions.