Office Space
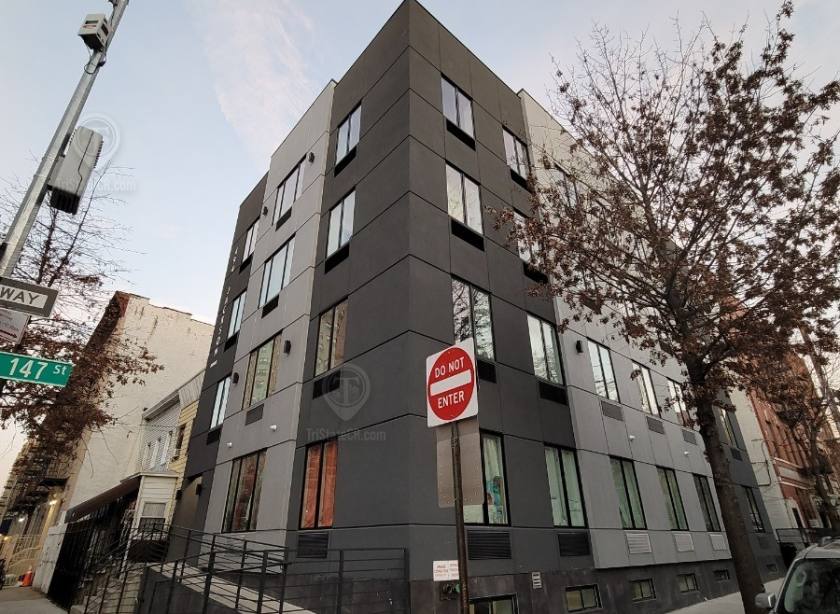
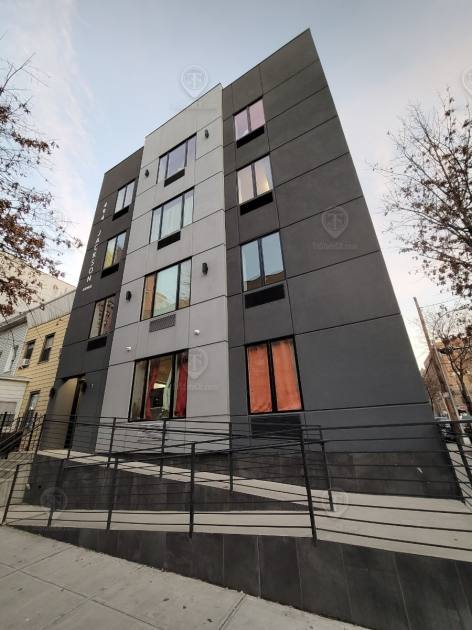
494 Jackson Avenue The Bronx, NY 10455
494 Jackson Avenue The Bronx, NY 10455
Details & Description
Property Highlights
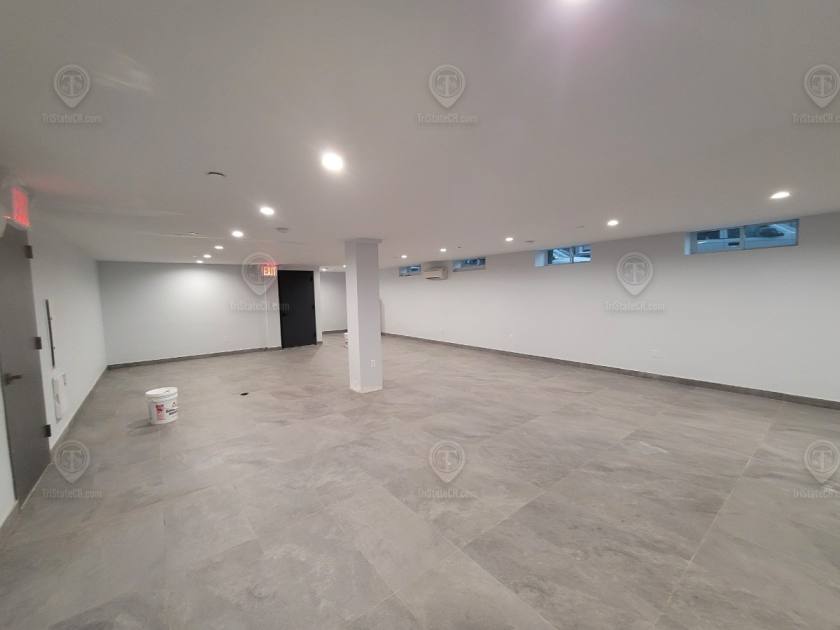
- • Lower level space with windows
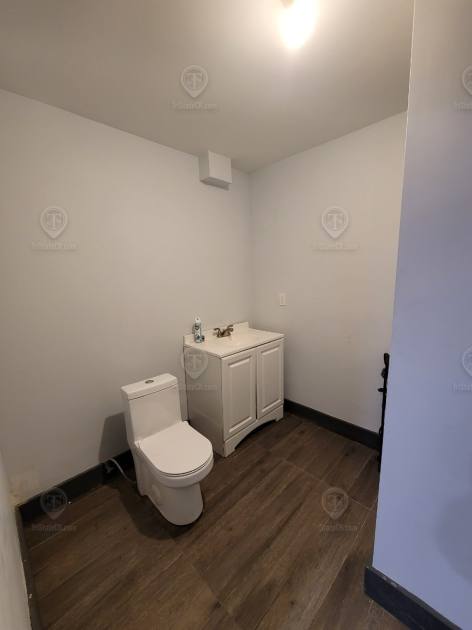
- • Private bathroom
- • Private heating/cooling system
- • Private entrance
- • Sunlight
- • Fully finished turn-key
Additional Photos


Listing Agents

Shlomi Bagdadi
O: 718-437-6100
info@tristatecr.com
O: 718-437-6100
info@tristatecr.com
While we strive to provide the most accurate information, all listing information, and demographic data, is provided by third-parties. As such, MyEListing will not be responsible for the accuracy of the information. It is strongly recommended that you verify all information with the listing agent, and any relevant agencies, prior to making any decisions.