Office Space
817 Main Street Cincinnati, OH 45202
817 Main Street Cincinnati, OH 45202

Details & Description
Property Highlights
- • Newly renovated
- • Aggressive Lease
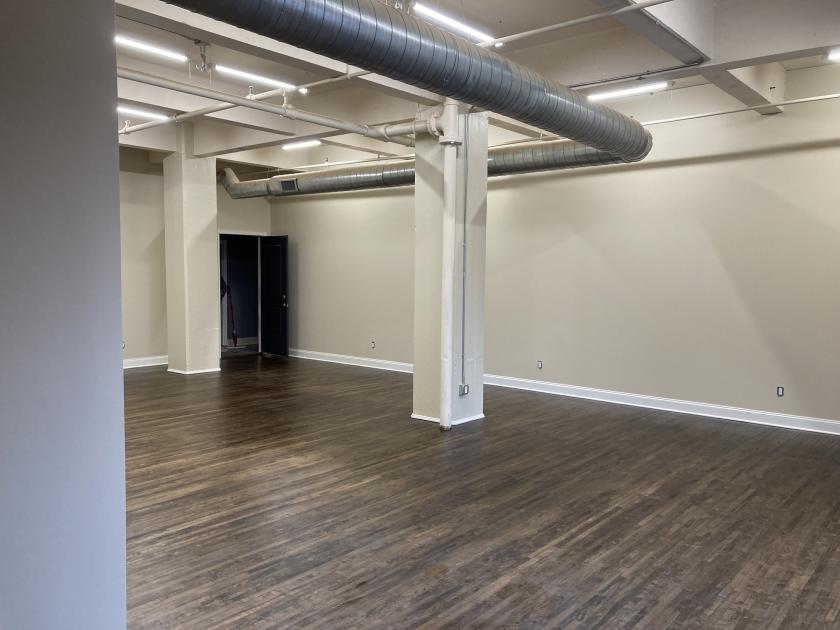
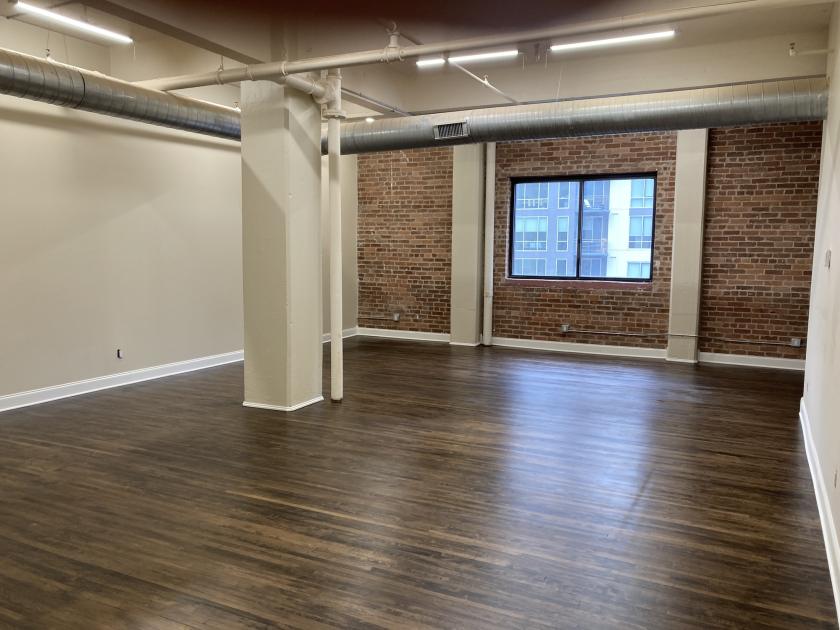
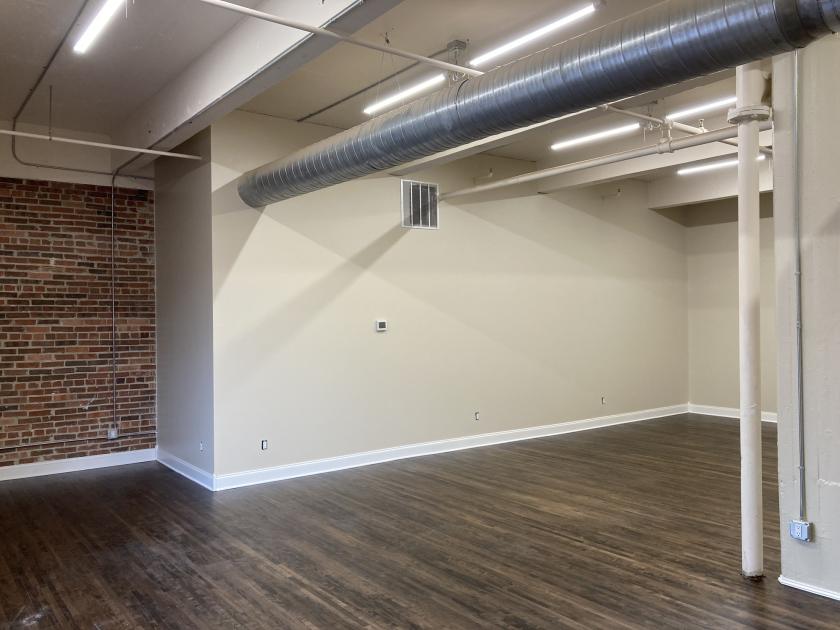
- • Great open floor plan
- • Natural Light
- • Private Bathroom
- • On the Street Car Line
Additional Photos
Listing Agents

Richard Ferguson
O: 513-769-1700
M: 513-322-8329
rferguson@bergmancommercial.com
O: 513-769-1700
M: 513-322-8329
rferguson@bergmancommercial.com
While we strive to provide the most accurate information, all listing information, and demographic data, is provided by third-parties. As such, MyEListing will not be responsible for the accuracy of the information. It is strongly recommended that you verify all information with the listing agent, and any relevant agencies, prior to making any decisions.


