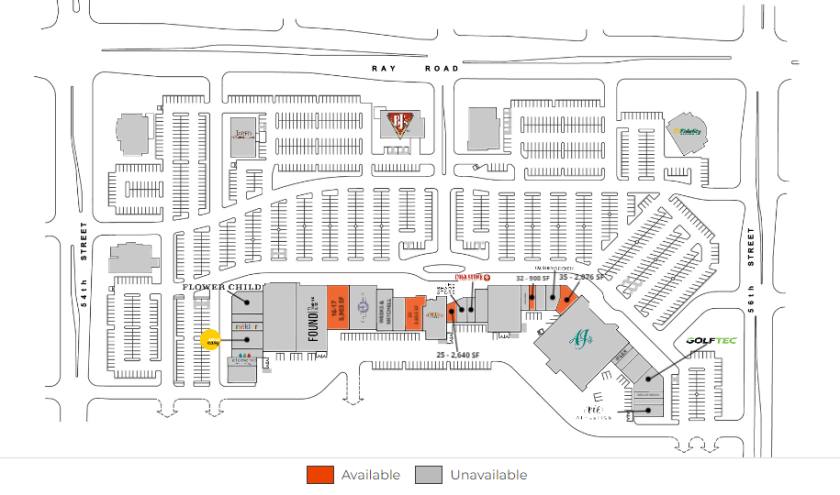
Retail Space
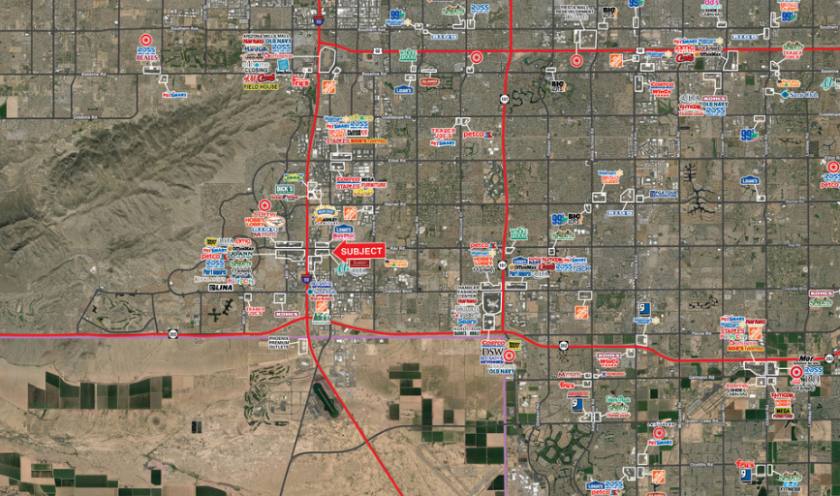
7131 West Ray Road Chandler, AZ 85226
7131 West Ray Road Chandler, AZ 85226

Details & Description
Property Highlights
- • Year Built 1999
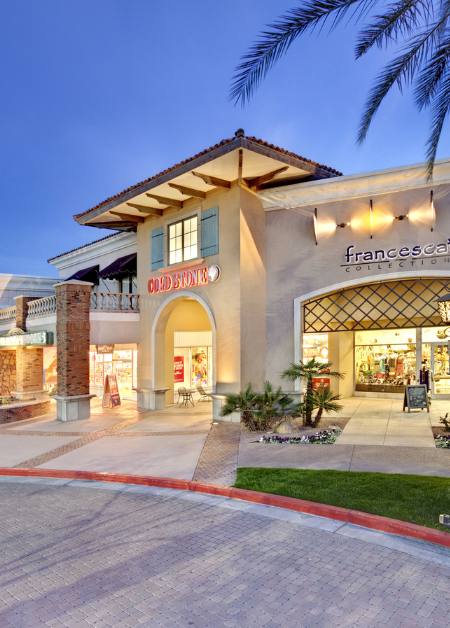
- • Strong national & local tenant mix
- • More than 110,000 employees within 5 miles
- • Onsite Management
- • 2nd generation restaurant opportunities
Additional Photos

Listing Agents

Ryan Desmond
O: 602-931-4489
rdesmond@w-retail.com
O: 602-931-4489
rdesmond@w-retail.com

Bryan Babits
O: 602-931-4491
bbabits@w-retail.com
O: 602-931-4491
bbabits@w-retail.com

Katie Weeks
O: 602-368-1372
kweeks@w-retail.com
O: 602-368-1372
kweeks@w-retail.com
While we strive to provide the most accurate information, all listing information, and demographic data, is provided by third-parties. As such, MyEListing will not be responsible for the accuracy of the information. It is strongly recommended that you verify all information with the listing agent, and any relevant agencies, prior to making any decisions.


