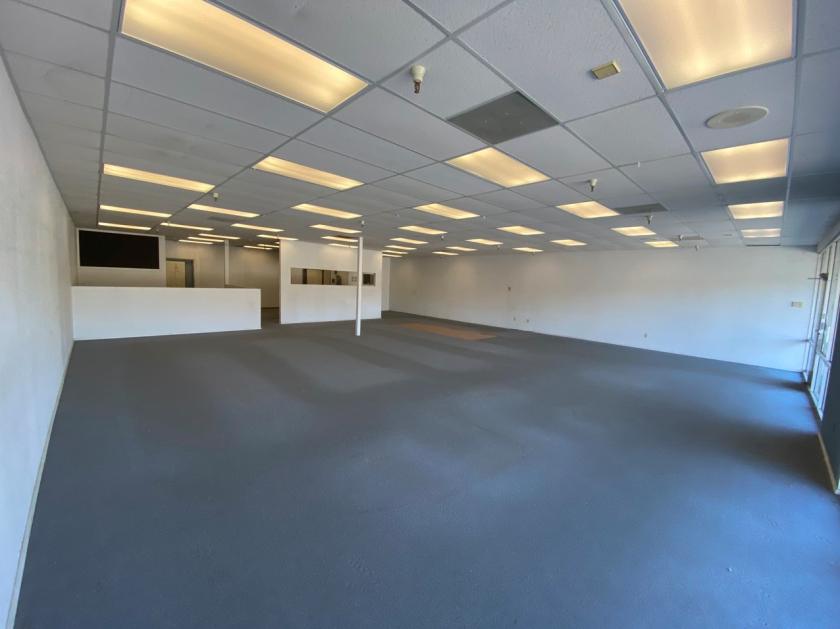
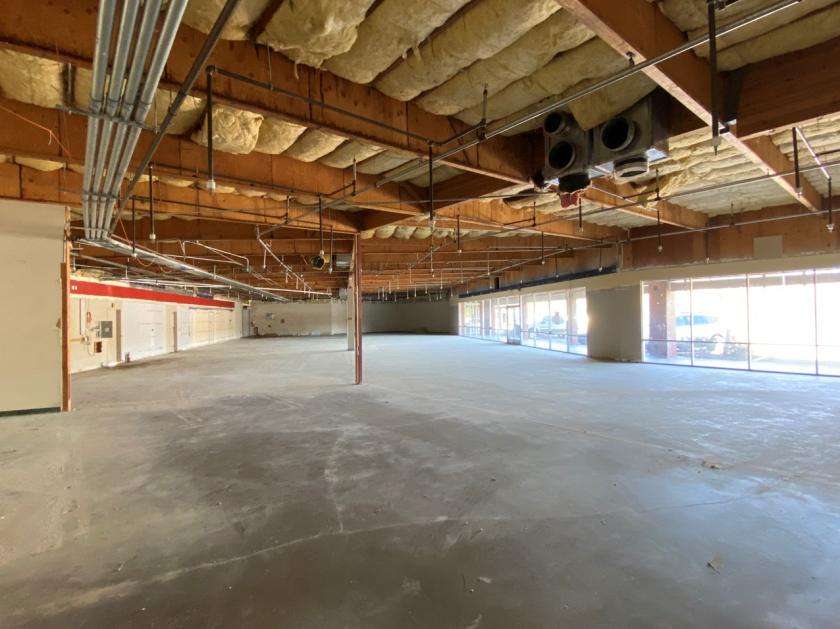
1-Mile | 3-Miles | 5-Miles | ||
---|---|---|---|---|
Total Population | 3,650 | 17,390 | 31,154 | |
Population Median Age | 41 | 44 | 44 | |
Population by Age | 0-9 Yrs | 348 (9%) | 1541 (8%) | 2804 (9%) |
10-19 Yrs | 399 (10%) | 1946 (11%) | 3463 (11%) | |
20-29 Yrs | 609 (16%) | 1997 (11%) | 3366 (10%) | |
30-39 Yrs | 428 (11%) | 2051 (11%) | 3391 (10%) | |
40-49 Yrs | 339 (9%) | 1862 (10%) | 3358 (10%) | |
50-59 Yrs | 704 (19%) | 2879 (16%) | 5210 (16%) | |
60-69 Yrs | 379 (10%) | 2658 (15%) | 4889 (15%) | |
70+ Yrs | 444 (12%) | 2456 (14%) | 4673 (14%) | |
Median HH Income | $67,760 | $66,476 | $68,182 | |
Total Household Income | < 24K | 263 (17%) | 1261 (17%) | 2221 (17%) |
25-49K | 290 (19%) | 1447 (20%) | 2443 (19%) | |
50-74K | 263 (17%) | 1195 (17%) | 2280 (18%) | |
75-99K | 173 (11%) | 712 (10%) | 1415 (11%) | |
100-199K | 348 (23%) | 1869 (26%) | 3297 (26%) | |
200K+ | 139 (9%) | 543 (7%) | 961 (7%) | |
Highest Education Level | No Diploma | 156 | 1118 | 1861 |
Diploma or GED | 624 | 3337 | 5977 | |
Some College | 724 | 3499 | 6330 | |
Assoc. Degree | 365 | 1554 | 2922 | |
Bachelors Degree | 585 | 2578 | 4436 | |
Higher Degree | 214 | 1022 | 2041 | |
Total Housing Units | 1,584 | 7,527 | 13,621 | |
--Owner-Occupied | 932 | 4,812 | 9,073 | |
--Renter-Occupied | 545 | 2,216 | 3,546 | |
Owner-Occupied Values | < 100K | 100 | 440 | 740 |
100-199K | 43 | 220 | 531 | |
200-299K | 178 | 744 | 1273 | |
300-399K | 232 | 1222 | 2296 | |
400-499K | 240 | 1105 | 1818 | |
500K+ | 138 | 1081 | 2415 | |
Total Working Age Population | 3,099 | 14,758 | 26,231 | |
In Work Force | 2,011 | 8,608 | 14,800 | |
Not In Work Force | 1,088 | 6,149 | 11,430 | |
Workforce Employed | 1,870 | 8,145 | 13,903 | |
Workforce Unemployed | 141 | 463 | 897 | |
Civlian Workforce | 2,011 | 8,608 | 14,800 | |
Military Workforce | 0 | 0 | 0 | |
Total Households | 1,477 | 7,027 | 12,618 | |
Family Households | 917 | 4,485 | 8,217 | |
Non-Family Households | 560 | 2,543 | 4,401 | |
Married Couple | 702 | 3,586 | 6,792 | |
Other Family | 214 | 899 | 1,425 | |
Married w/Child | 246 | 1,241 | 2,221 | |
Single Male w/Child | 25 | 142 | 189 | |
Single Female w/Child | 64 | 202 | 291 |
Population Change Last Two Decades - Plus Projection
2000 | % | 2010 | % | 2020 | % | 2030 | |
---|---|---|---|---|---|---|---|
California | 33,871,648 | +10 | 37,253,956 | +9 | 40,467,295 | +8 | 43,631,295 |
El Dorado County | 156,299 | +16 | 181,058 | +6 | 191,581 | +9 | 208,457 |
Total Working Age Population:
Total Households:
Total Working Age Population:
Total Households:
Total Working Age Population:
Total Households: