Office Space
2322 Lakeview Drive Dayton, OH 45431
2322 Lakeview Drive Dayton, OH 45431

Details & Description
Property Highlights
- • 10,460 SF
- • $15/SF NNN
- • Newer construction - built in 2006
- • Ample Parking on all sides
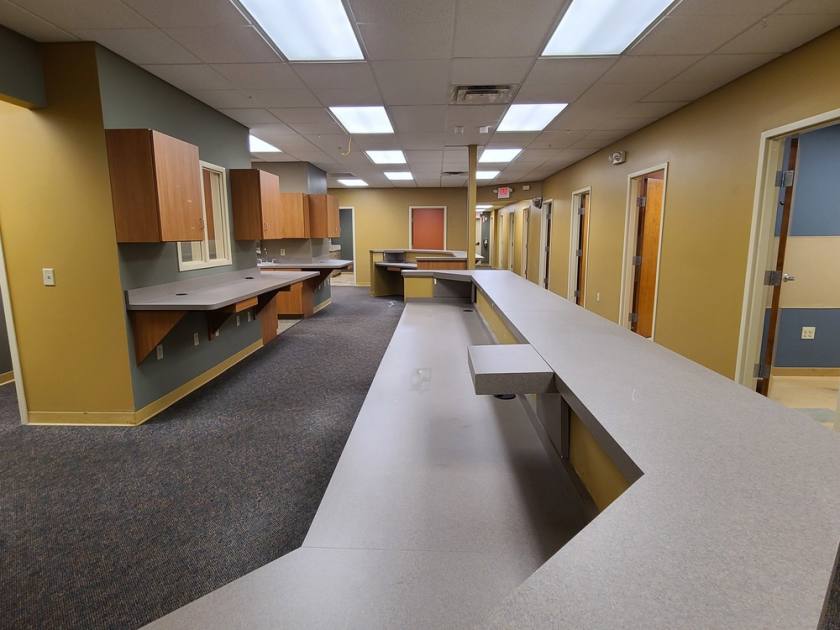
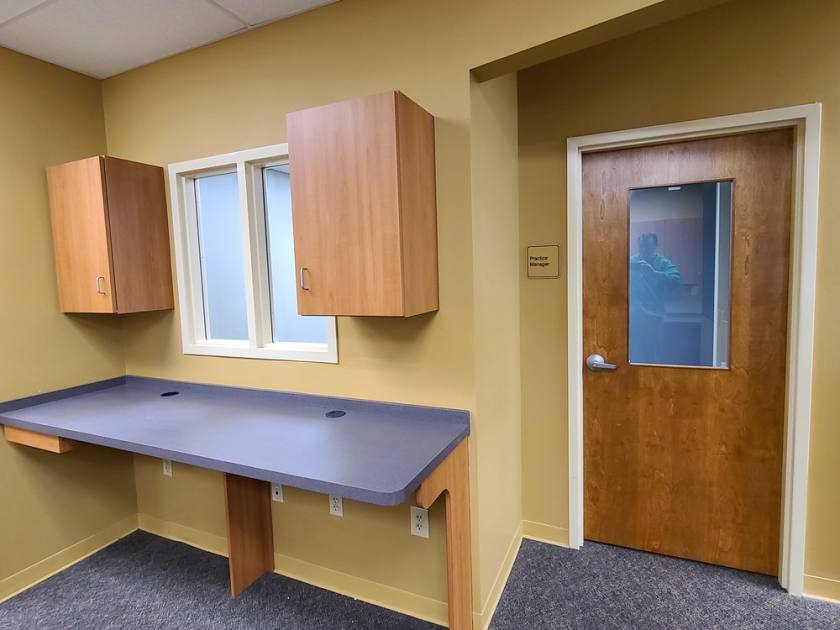
- • Reception area
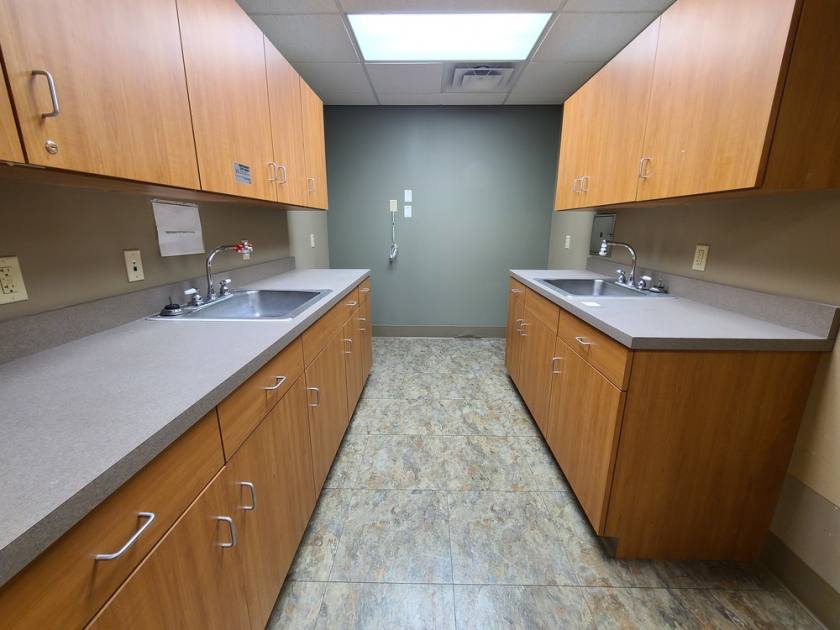
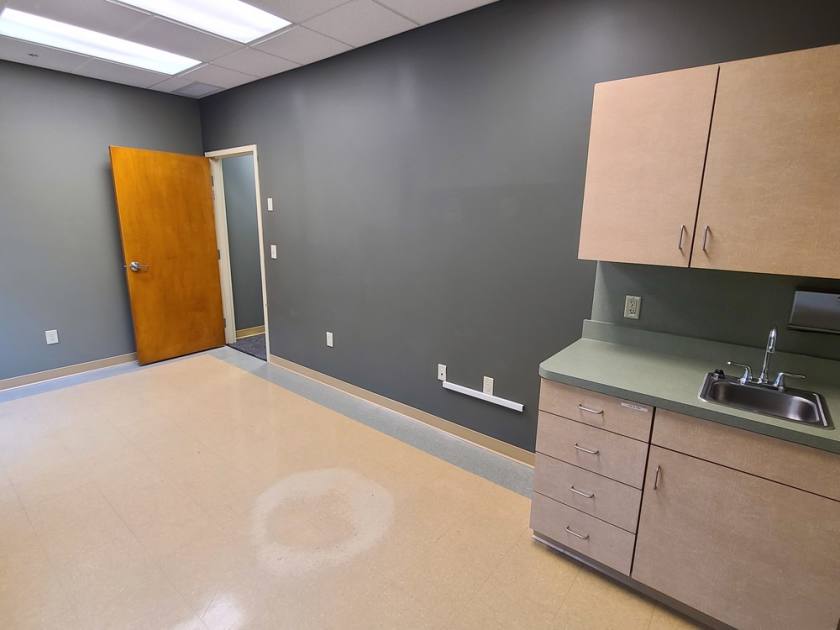
- • Ample exam rooms
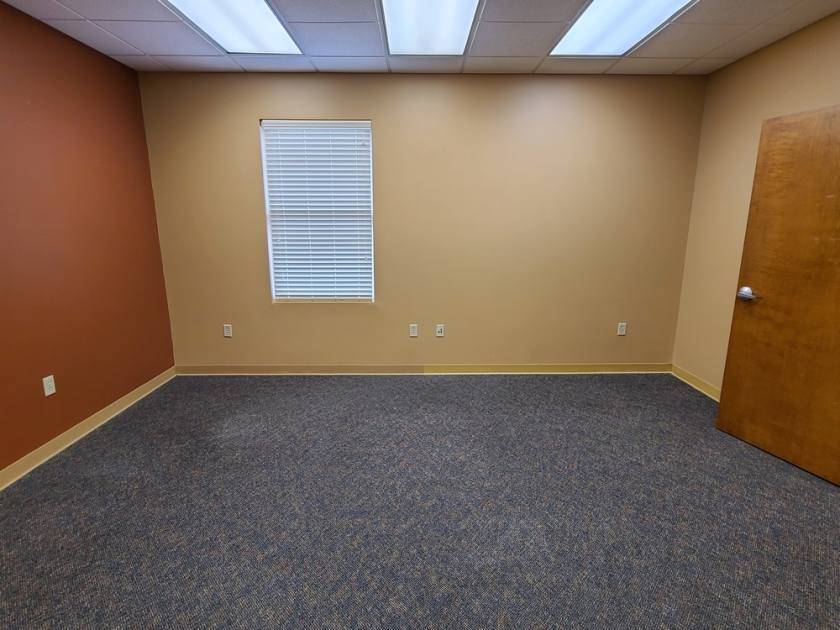
Additional Photos


Listing Agents

Scott Kaster
O: 937-673-4366
M: 937-673-4366
scott@bergmancommercial.com
O: 937-673-4366
M: 937-673-4366
scott@bergmancommercial.com
While we strive to provide the most accurate information, all listing information, and demographic data, is provided by third-parties. As such, MyEListing will not be responsible for the accuracy of the information. It is strongly recommended that you verify all information with the listing agent, and any relevant agencies, prior to making any decisions.