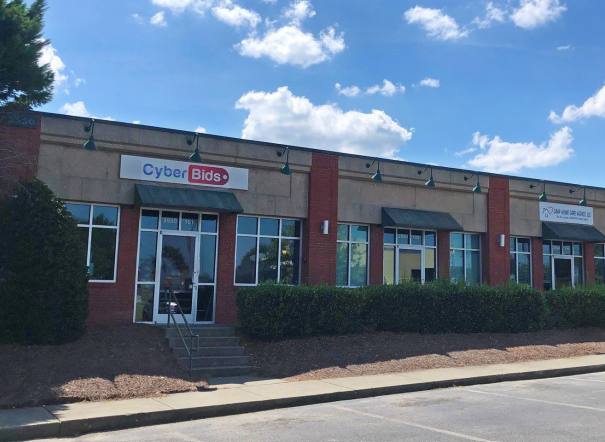
1-Mile | 3-Miles | 5-Miles | ||
---|---|---|---|---|
Total Population | 1,107 | 7,840 | 17,129 | |
Population Median Age | 38 | 39 | 39 | |
Population by Age | 0-9 Yrs | 180 (16%) | 1051 (13%) | 1787 (10%) |
10-19 Yrs | 81 (7%) | 797 (10%) | 2113 (12%) | |
20-29 Yrs | 130 (11%) | 924 (11%) | 2352 (13%) | |
30-39 Yrs | 113 (10%) | 782 (9%) | 1856 (10%) | |
40-49 Yrs | 214 (19%) | 1373 (17%) | 2873 (16%) | |
50-59 Yrs | 228 (20%) | 1472 (18%) | 3032 (17%) | |
60-69 Yrs | 106 (9%) | 774 (9%) | 1657 (9%) | |
70+ Yrs | 53 (4%) | 666 (8%) | 1458 (8%) | |
Median HH Income | $65,478 | $63,701 | $61,951 | |
Total Household Income | < 24K | 49 (11%) | 378 (13%) | 769 (14%) |
25-49K | 95 (21%) | 671 (23%) | 1276 (24%) | |
50-74K | 130 (29%) | 722 (25%) | 1168 (22%) | |
75-99K | 83 (18%) | 497 (17%) | 897 (16%) | |
100-199K | 83 (18%) | 587 (20%) | 1117 (21%) | |
200K+ | 2 (0%) | 20 (0%) | 59 (1%) | |
Highest Education Level | No Diploma | 129 | 1104 | 1986 |
Diploma or GED | 253 | 1607 | 3787 | |
Some College | 148 | 1067 | 2424 | |
Assoc. Degree | 68 | 517 | 1129 | |
Bachelors Degree | 120 | 800 | 1604 | |
Higher Degree | 54 | 407 | 931 | |
Total Housing Units | 542 | 3,360 | 6,042 | |
--Owner-Occupied | 307 | 2,058 | 3,917 | |
--Renter-Occupied | 134 | 816 | 1,368 | |
Owner-Occupied Values | < 100K | 53 | 454 | 950 |
100-199K | 104 | 788 | 1631 | |
200-299K | 147 | 770 | 1142 | |
300-399K | 0 | 25 | 119 | |
400-499K | 2 | 14 | 29 | |
500K+ | 0 | 7 | 46 | |
Total Working Age Population | 872 | 6,235 | 14,100 | |
In Work Force | 585 | 3,871 | 7,585 | |
Not In Work Force | 287 | 2,364 | 6,515 | |
Workforce Employed | 562 | 3,705 | 7,175 | |
Workforce Unemployed | 23 | 159 | 383 | |
Civlian Workforce | 585 | 3,864 | 7,558 | |
Military Workforce | 0 | 7 | 27 | |
Total Households | 441 | 2,874 | 5,285 | |
Family Households | 362 | 2,329 | 4,278 | |
Non-Family Households | 79 | 545 | 1,007 | |
Married Couple | 264 | 1,662 | 3,101 | |
Other Family | 98 | 667 | 1,178 | |
Married w/Child | 105 | 611 | 1,064 | |
Single Male w/Child | 14 | 132 | 255 | |
Single Female w/Child | 29 | 207 | 402 |
Population Change Last Two Decades - Plus Projection
2000 | % | 2010 | % | 2020 | % | 2030 | |
---|---|---|---|---|---|---|---|
North Carolina | 8,049,313 | +18 | 9,535,483 | +11 | 10,630,691 | +11 | 11,836,070 |
Wake County | 627,846 | +44 | 900,993 | +23 | 1,109,883 | +20 | 1,328,336 |
Durham County | 223,314 | +20 | 267,587 | +20 | 320,322 | +14 | 366,111 |
Granville County | 48,498 | +24 | 59,916 | +4 | 62,147 | +12 | 69,540 |
Total Working Age Population:
Total Households:
Total Working Age Population:
Total Households:
Total Working Age Population:
Total Households: