Retail Space
1955 South Stapley Drive Mesa, AZ 85204
1955 South Stapley Drive Mesa, AZ 85204

Details & Description
Property Highlights
- • Year Built 1999
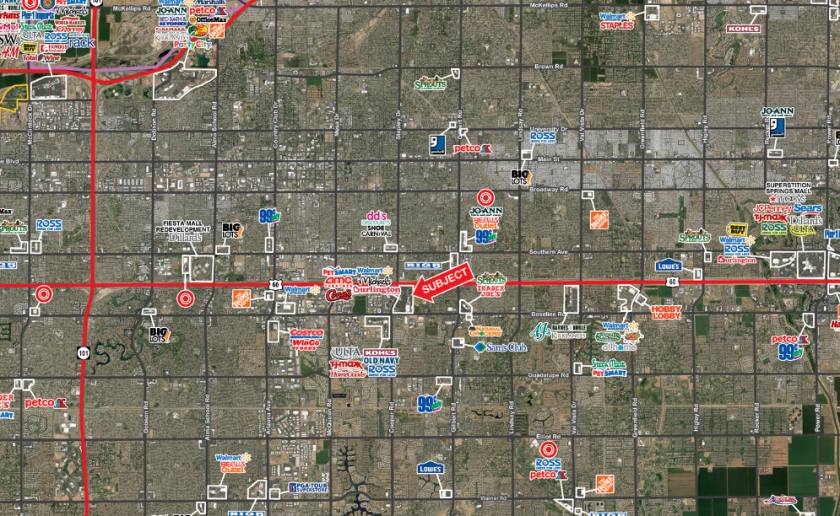
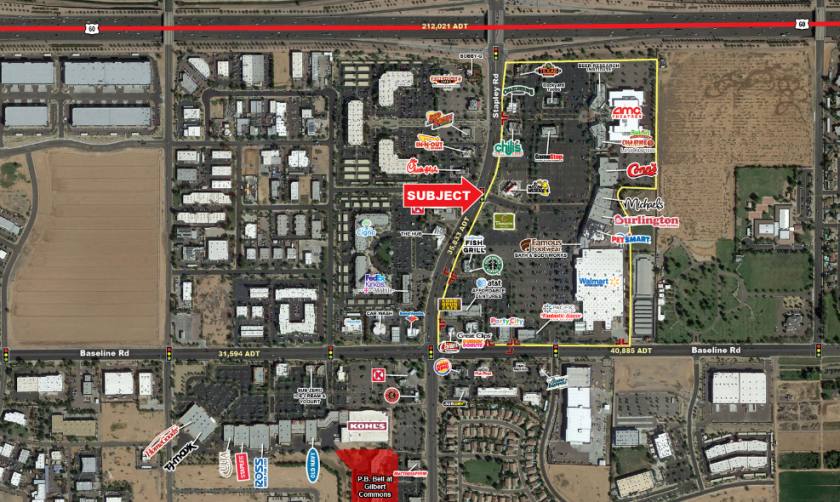
- • Dominant Power Center off the US-60 at Stapley Dr
- • Located right off US 60 Fwy with over 212,000 VPD
- • Over 155,000 people within a 3-mile radius
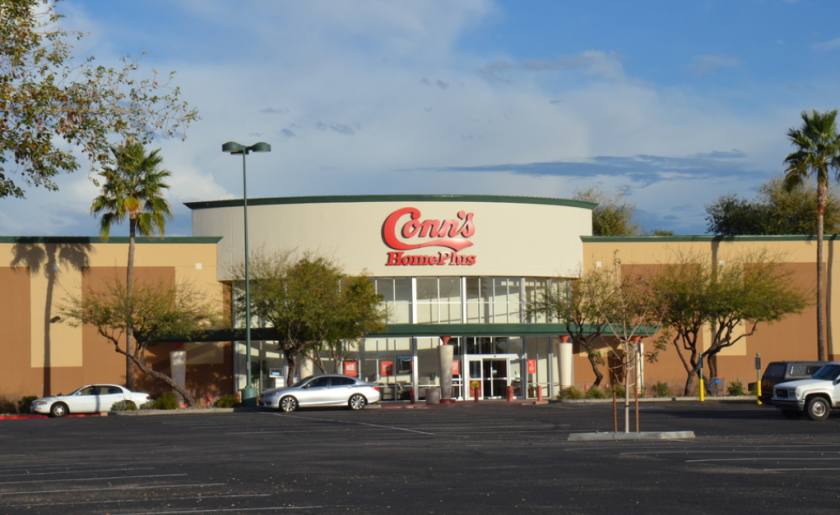
Additional Photos


Listing Agents

Bryan Ledbetter
O: 602-795-8670
bledbetter@w-retail.com
O: 602-795-8670
bledbetter@w-retail.com

Bryan Babits
O: 602-931-4491
bbabits@w-retail.com
O: 602-931-4491
bbabits@w-retail.com

Katie Weeks
O: 602-368-1372
kweeks@w-retail.com
O: 602-368-1372
kweeks@w-retail.com
While we strive to provide the most accurate information, all listing information, and demographic data, is provided by third-parties. As such, MyEListing will not be responsible for the accuracy of the information. It is strongly recommended that you verify all information with the listing agent, and any relevant agencies, prior to making any decisions.