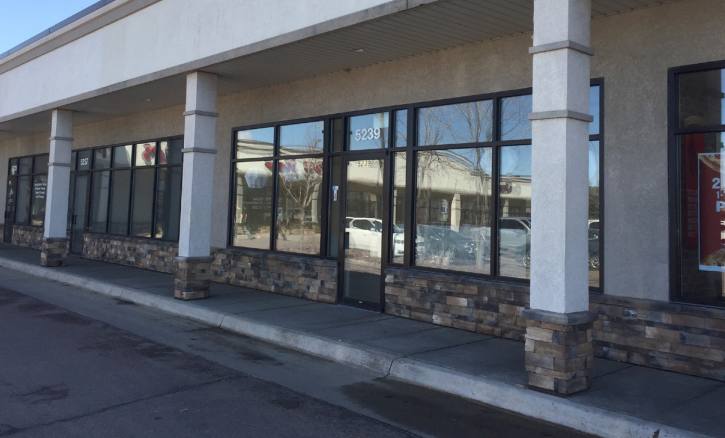
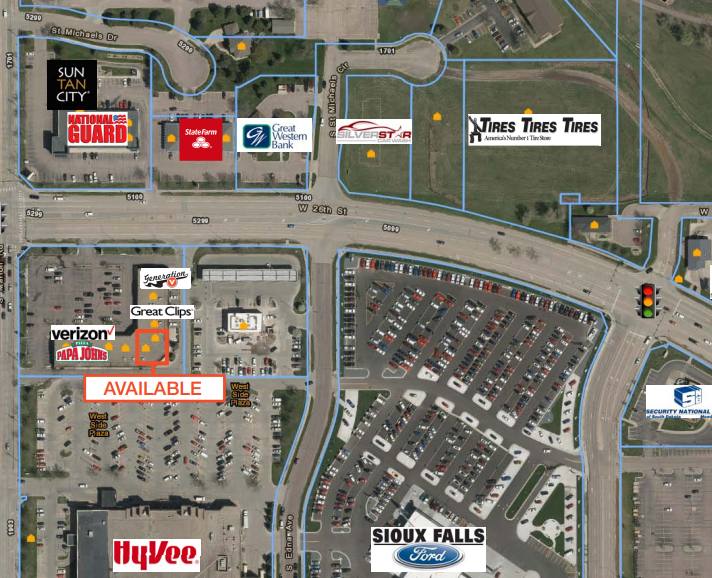
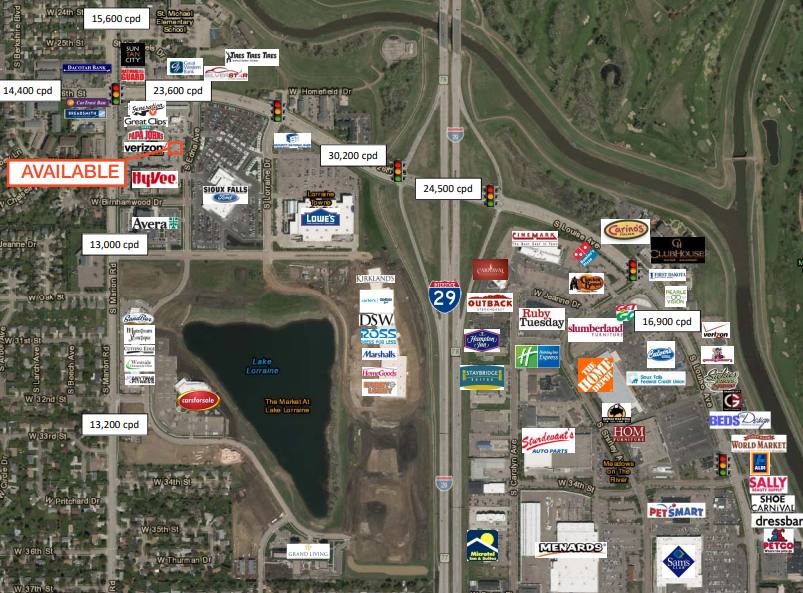
Retail Space
5231 West 26th Street Sioux Falls, SD 57106
5231 West 26th Street Sioux Falls, SD 57106
Details & Description
Property Highlights
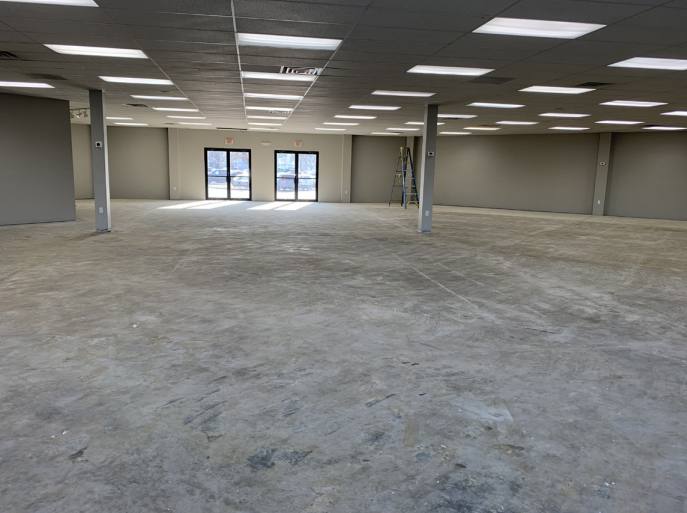
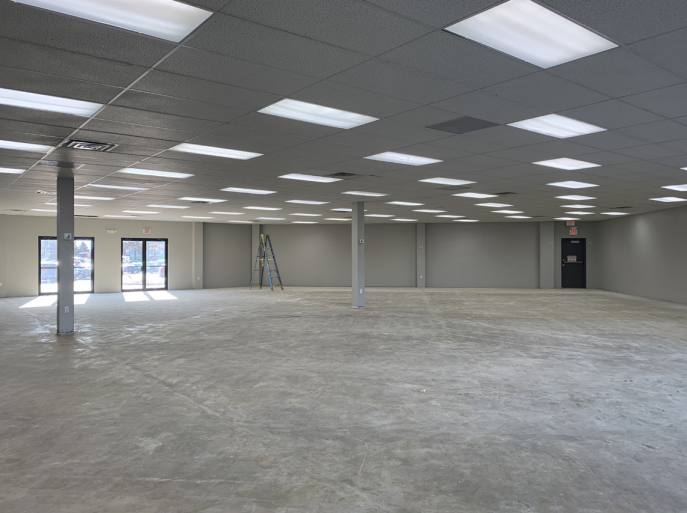
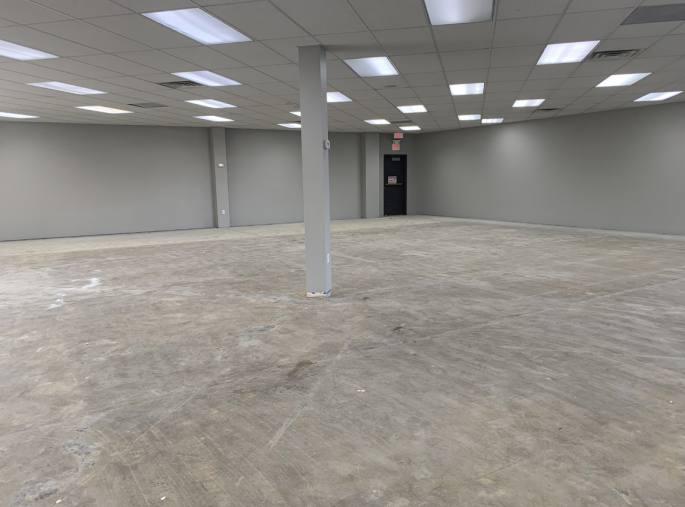
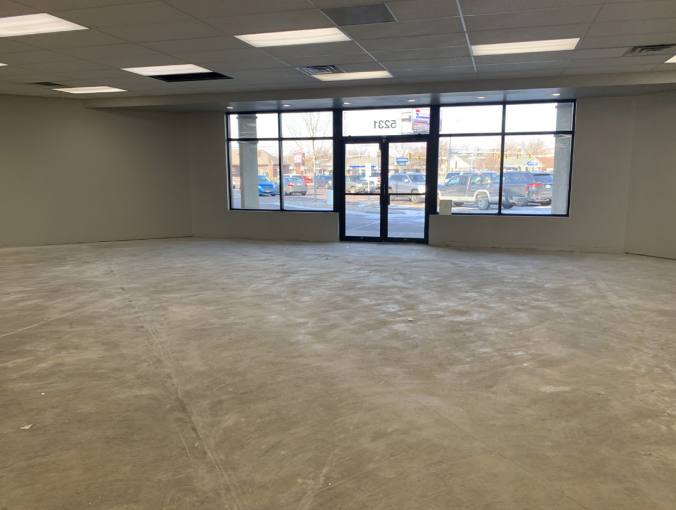
• Currently undergoing multiple updates to the space!
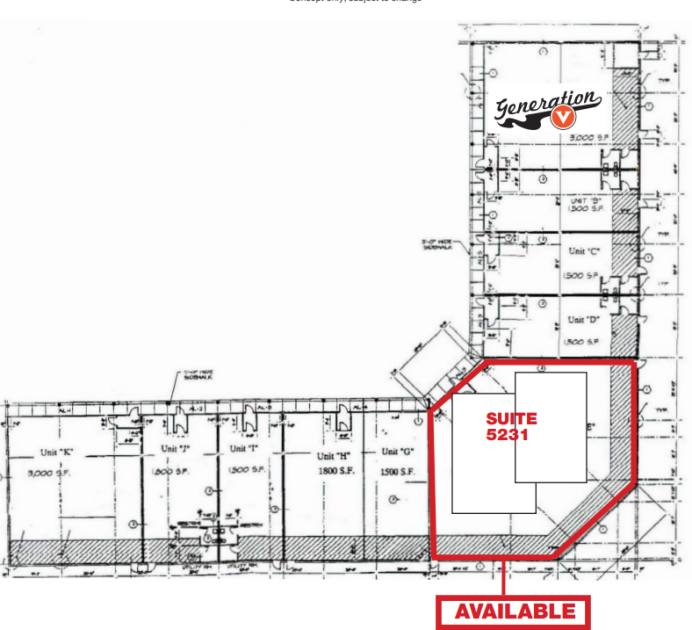
• Suite offers open floor plan with en-suite restrooms.
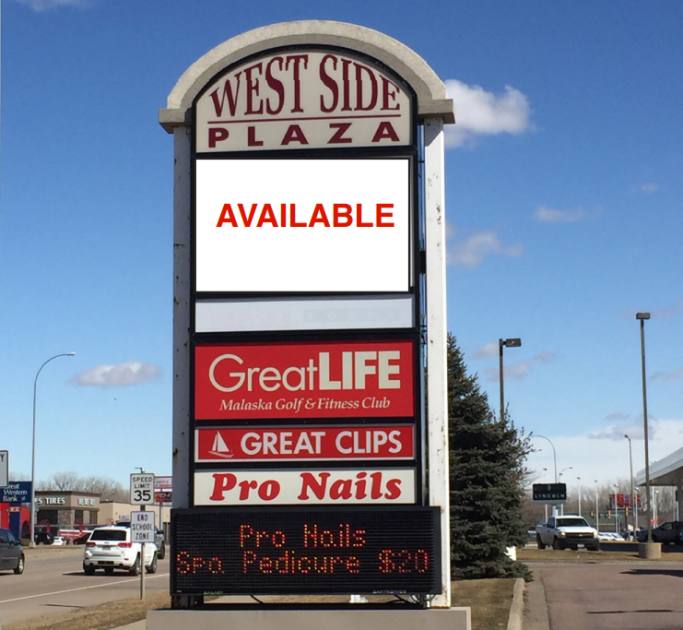
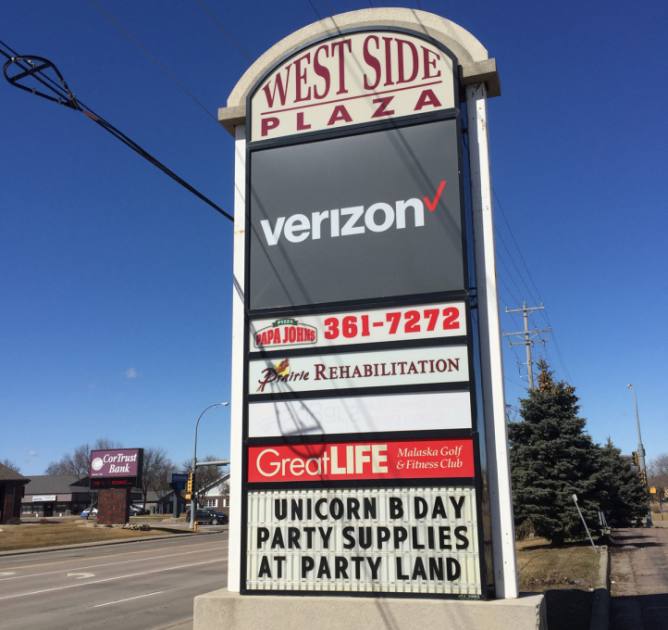
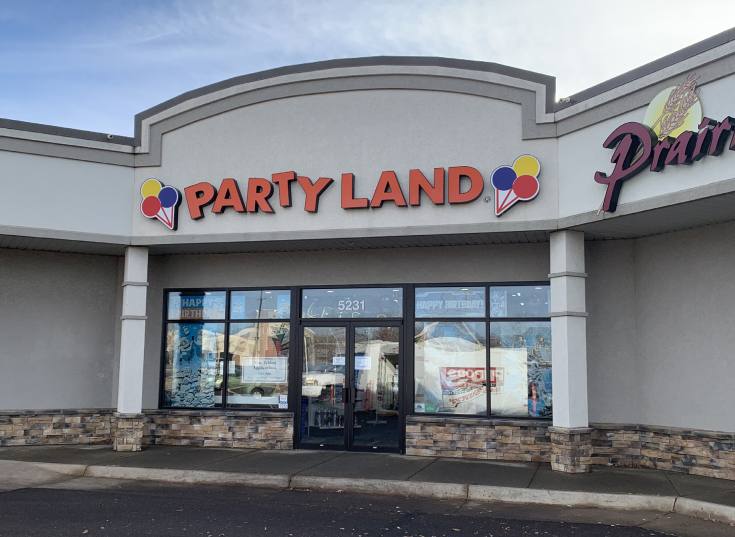
Additional Photos
Listing Agents

Raquel Blount
O: 605-728-9092
raquel@lloydcompanies.com
O: 605-728-9092
raquel@lloydcompanies.com
While we strive to provide the most accurate information, all listing information, and demographic data, is provided by third-parties. As such, MyEListing will not be responsible for the accuracy of the information. It is strongly recommended that you verify all information with the listing agent, and any relevant agencies, prior to making any decisions.