Retail Space
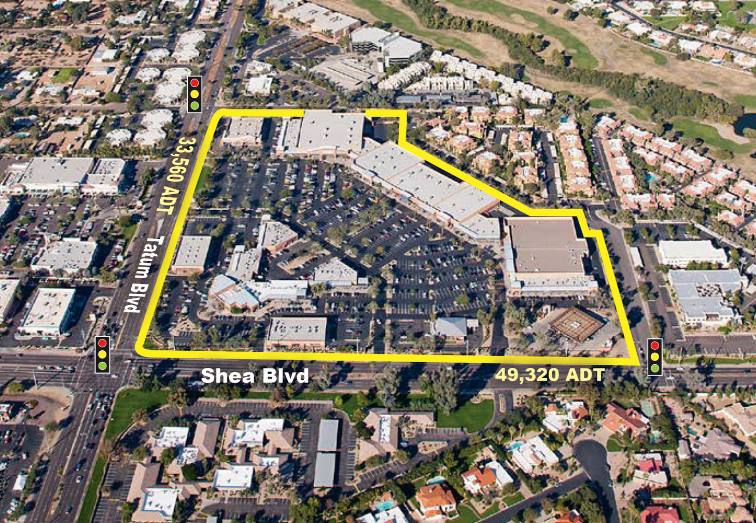
NEC of Tatum Blvd and Shea Blvd Phoenix, AZ 85028
NEC of Tatum Blvd and Shea Blvd Phoenix, AZ 85028
Details & Description
Property Highlights
• Dense population count (214,889 in a 5 mile radius) and high incomes ($123,925 in a 5 mile radius).
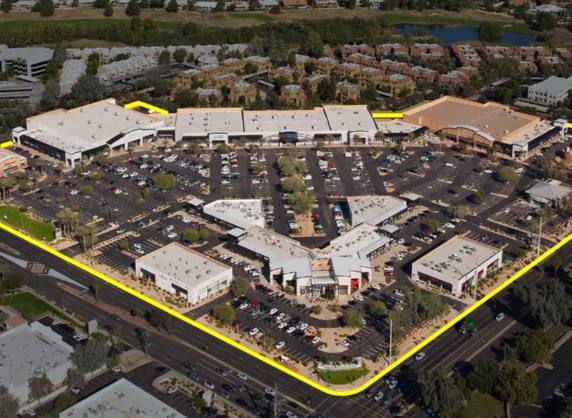
• The 295,192 SF retail property offers great visibility and access from a major intersection of Tatum & Shea.
Listing Agents

Jake McClaughry
O: 602-368-1088
jmcclaughry@w-retail.com
O: 602-368-1088
jmcclaughry@w-retail.com

Alberto Caballero
Western Retail Advisors
O: 602-778-3747
M: 602-778-3741
acaballero@w-retail.com
Western Retail Advisors
O: 602-778-3747
M: 602-778-3741
acaballero@w-retail.com
While we strive to provide the most accurate information, all listing information, and demographic data, is provided by third-parties. As such, MyEListing will not be responsible for the accuracy of the information. It is strongly recommended that you verify all information with the listing agent, and any relevant agencies, prior to making any decisions.