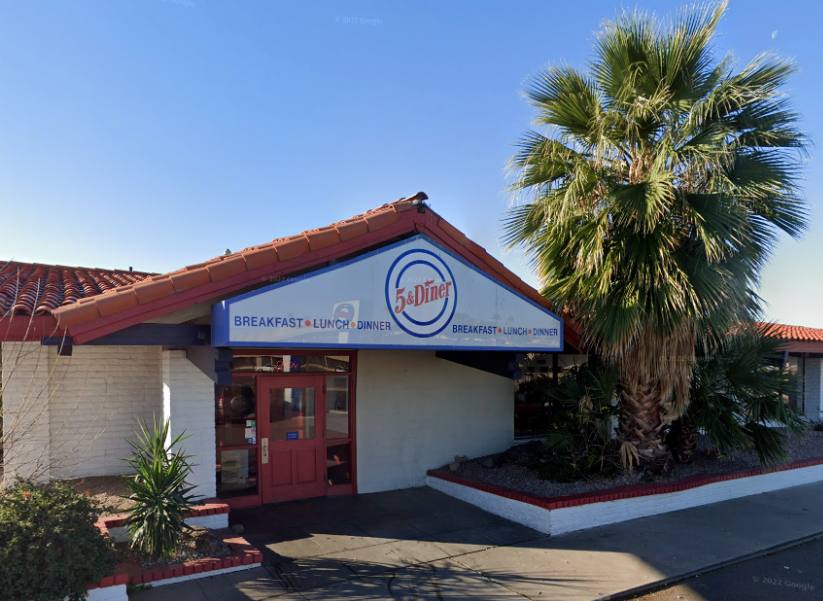
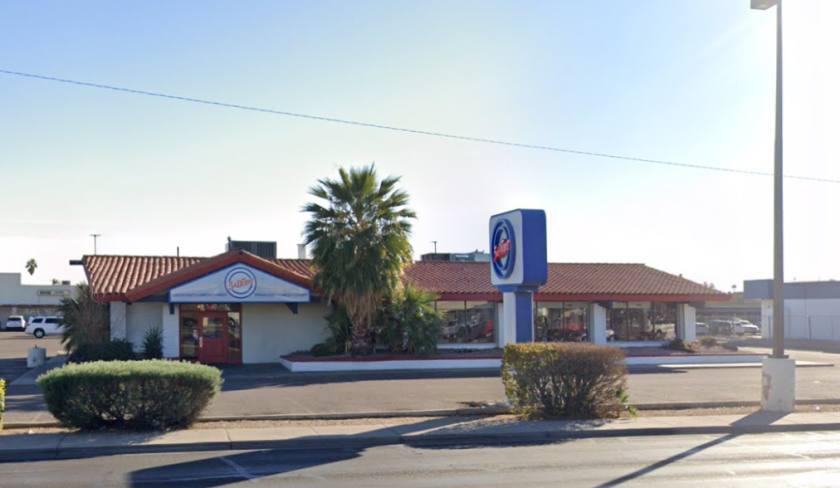
Retail Space
3567 West Northern Avenue Phoenix, AZ 85051
3567 West Northern Avenue Phoenix, AZ 85051
Details & Description
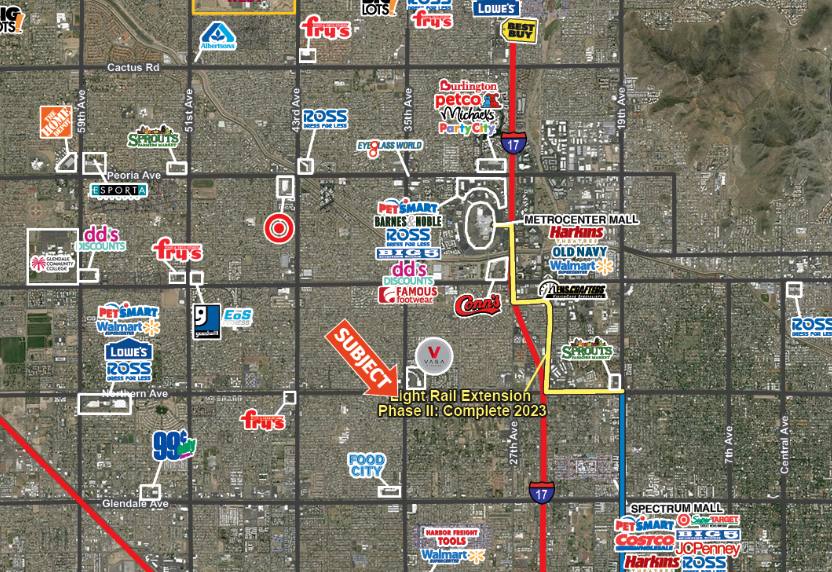
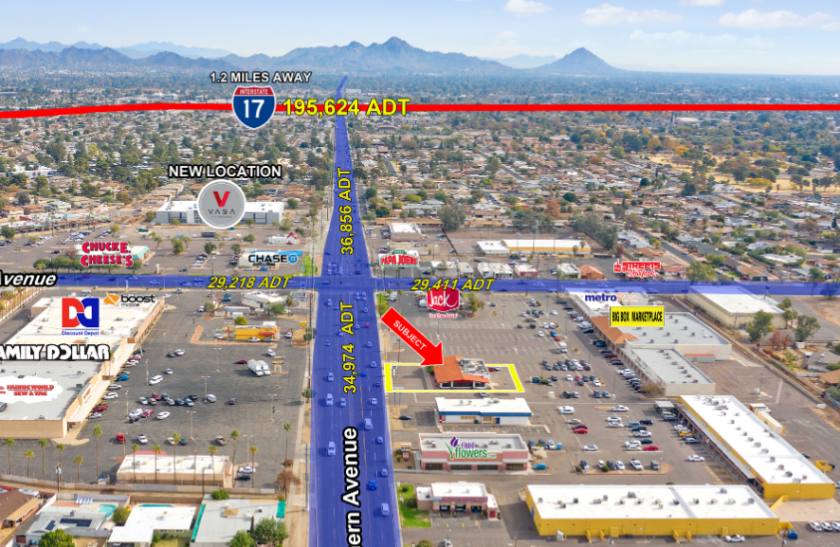
Property Highlights
- • Freestanding Restaurant Available for GL or Sale
- • Redevelopment Opportunity
- • Only one mile from Interstate 17
- • Monument Signage Available along Northern Avenue
Additional Photos

Listing Agents

Bryan Babits
O: 602-931-4491
bbabits@w-retail.com
O: 602-931-4491
bbabits@w-retail.com

Jake McClaughry
O: 602-368-1088
jmcclaughry@w-retail.com
O: 602-368-1088
jmcclaughry@w-retail.com

Katie Weeks
O: 602-368-1372
kweeks@w-retail.com
O: 602-368-1372
kweeks@w-retail.com
While we strive to provide the most accurate information, all listing information, and demographic data, is provided by third-parties. As such, MyEListing will not be responsible for the accuracy of the information. It is strongly recommended that you verify all information with the listing agent, and any relevant agencies, prior to making any decisions.


