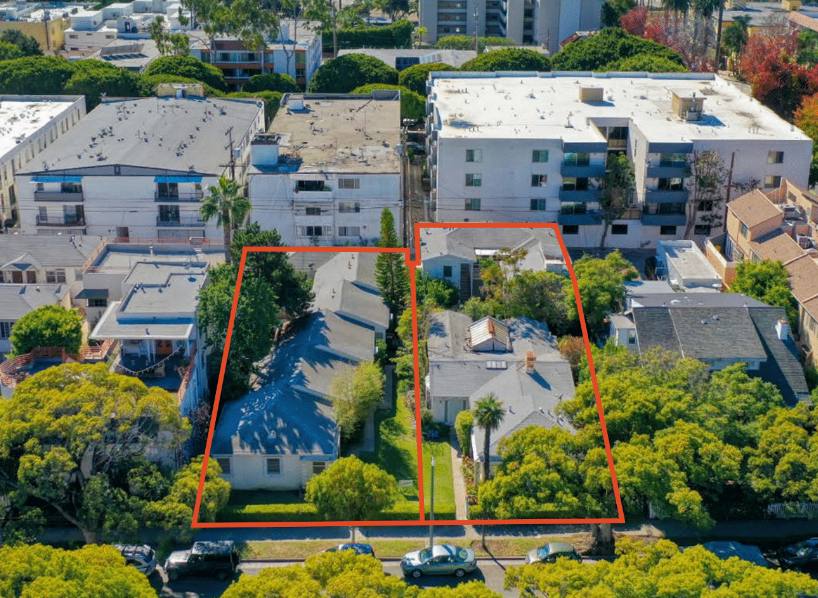
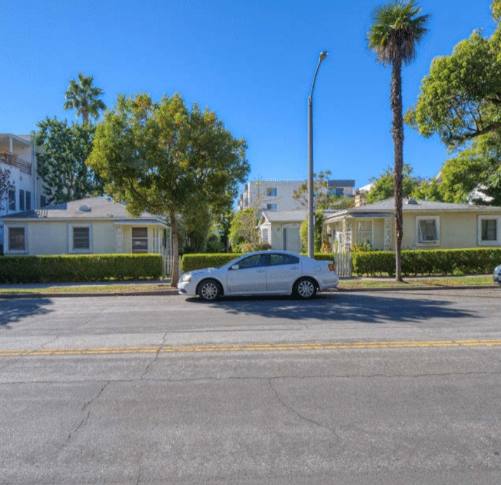
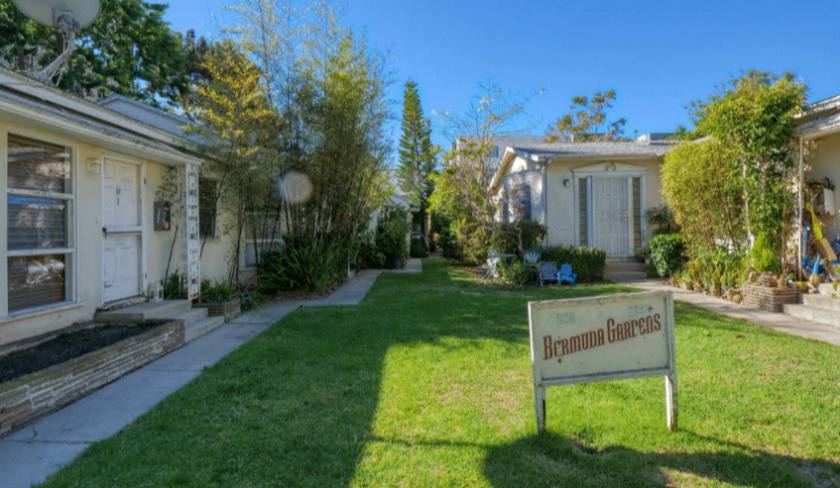
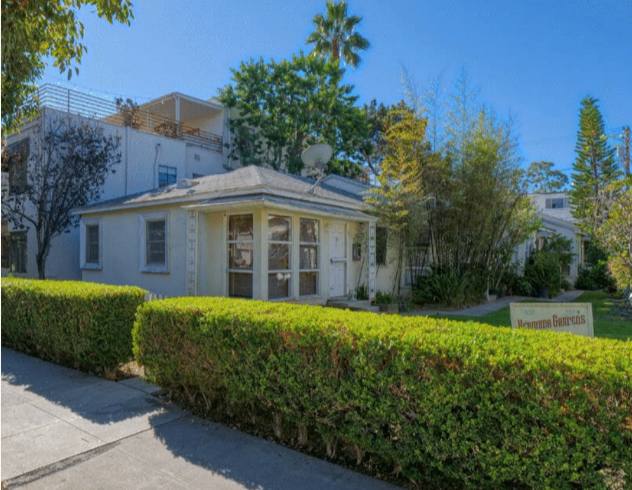
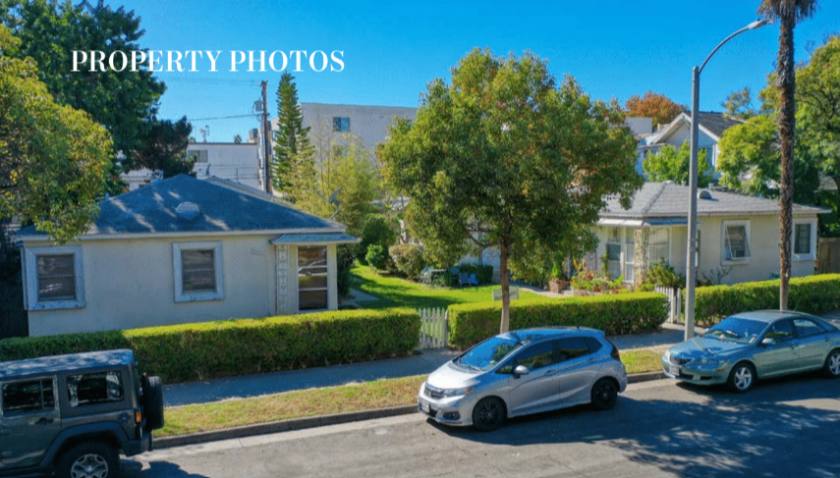
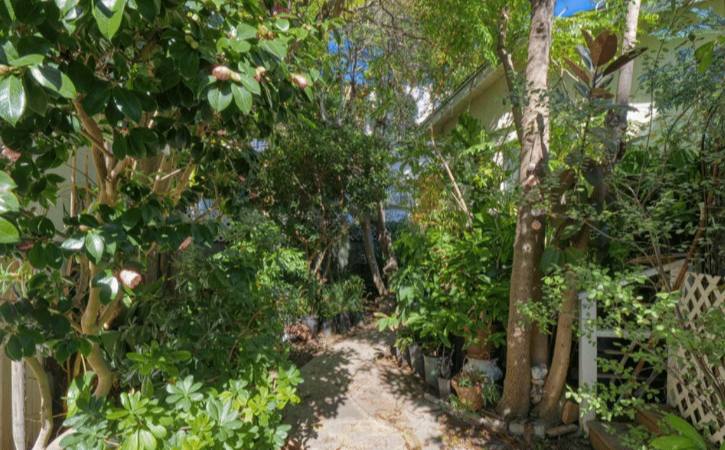
Originally constructed in 1908 and 1940, the Property consists of two single-story bungalow style structures and one two-story building situated on two contiguous lots totaling over15,000 square feet of land. 814 3rd Street is comprised of 9 units with 5 studios and 4one-bedroom, one-bath units. 820 3rd Street features a unit mix of 5 one-bedroom, one-bath units.814 & 320 3rd Street presents the rare opportunity for an investor to enter a high-demand rental market with the potential to significantly increase value by renovating units and stabilizing the property. Eight out of the fourteen units will be delivered vacant, providing the opportunity for an investor to immediately upgrade the units and capture market rents. The property is separately metered for electricity and gas and is equipped with 9 garages for tenant parking. Each unit includes their own washer and dryer or laundry hook ups. Through a systemic renovation program, a savvy investor will have the opportunity to capitalize on the rental upside. Additionally, the properties are zoned R3 (medium density residential), offering future development potential. *The Property is positioned in the highly coveted Wilshire Montana neighborhood of prime Santa Monica. Tenants enjoy being within walking distance to Montana Avenue and only three blocks from the beach. The Property is conveniently surrounded by nearby amenities including critically acclaimed restaurants, trendy bars, shopping, hotels, entertainment venues, and notable destinations including the Montana Ave shops, Downtown Santa Monica, 3rd Street Promenade, and The Santa Monica Pier. Further, the Property is situated among the major Silicon Beach and Culver City employment hubs. 814 & 320 3rd Street presents investors with the rare opportunity to acquire an ideally located, pride of ownership apartment building with significant upside and future development potential.