Commercial Land
1220 North Main Street Holly Springs, NC 27540
1220 North Main Street Holly Springs, NC 27540
Details & Description
Property Highlights
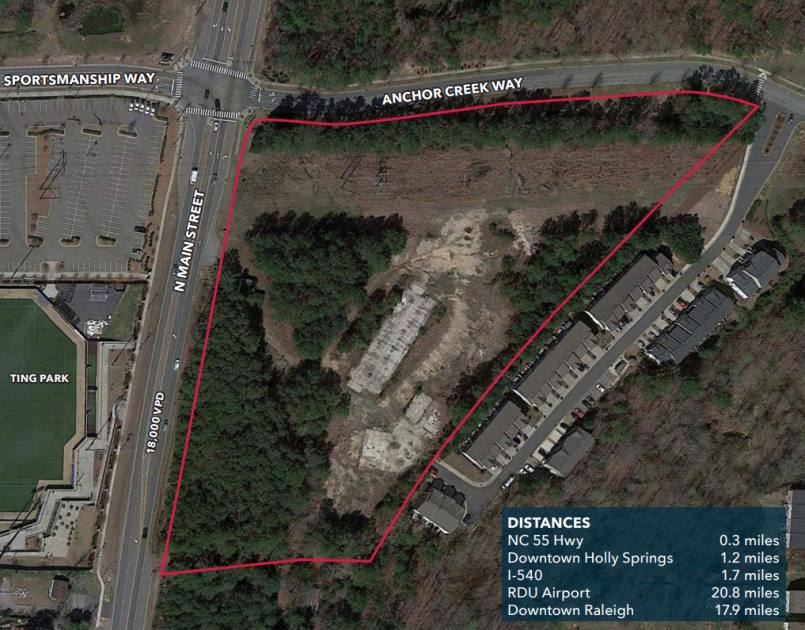
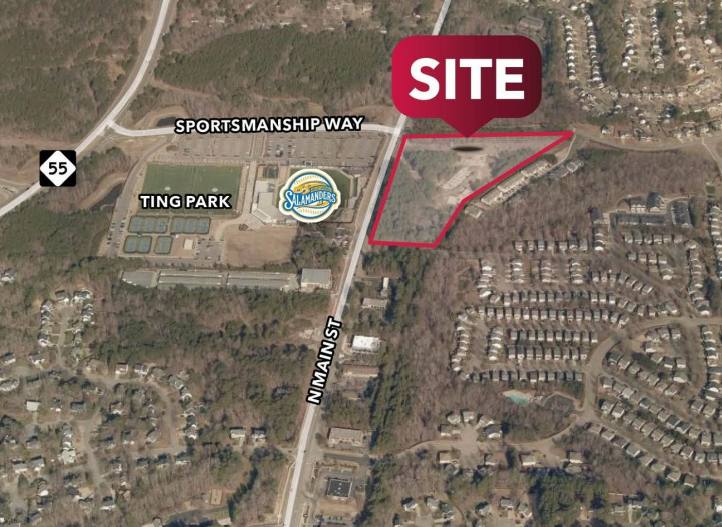
• Ting Park is a public multi-use athletic complex. The 1,800- seat Ting Stadium is home to the Holly Springs Salamanders
• Willing to subdivide for outparcels as small as one acre for a 25% per acre premium
Listing Agents

Moss Withers
O: 919-576-2501
M: 919-810-2492
mwithers@lee-associates.com
O: 919-576-2501
M: 919-810-2492
mwithers@lee-associates.com

Karah Jennings McConnell
O: 919-576-2502
M: 919-817-0705
kjennings@lee-associates.com
O: 919-576-2502
M: 919-817-0705
kjennings@lee-associates.com

Hunter Stewart
O: 919-576-2507
M: 919-548-3172
hstewart@lee-associates.com
O: 919-576-2507
M: 919-548-3172
hstewart@lee-associates.com
While we strive to provide the most accurate information, all listing information, and demographic data, is provided by third-parties. As such, MyEListing will not be responsible for the accuracy of the information. It is strongly recommended that you verify all information with the listing agent, and any relevant agencies, prior to making any decisions.