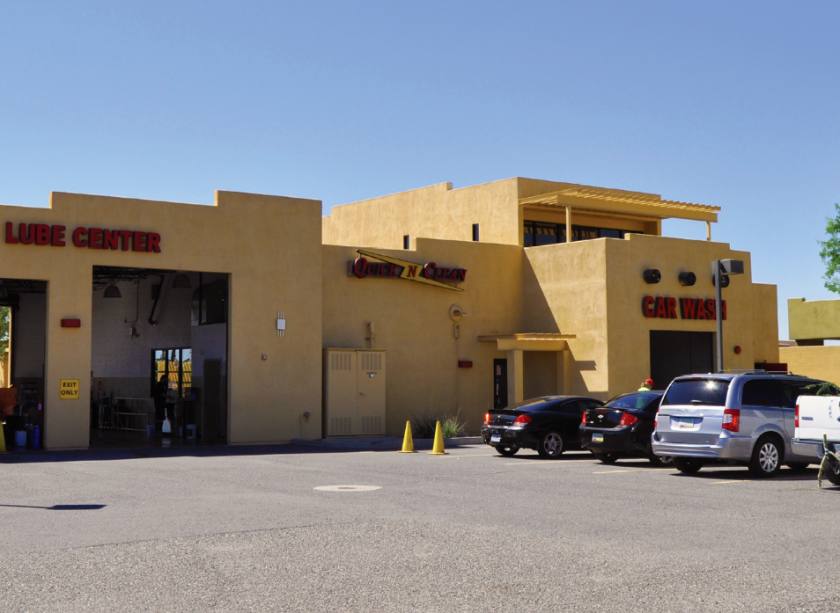
Retail Space
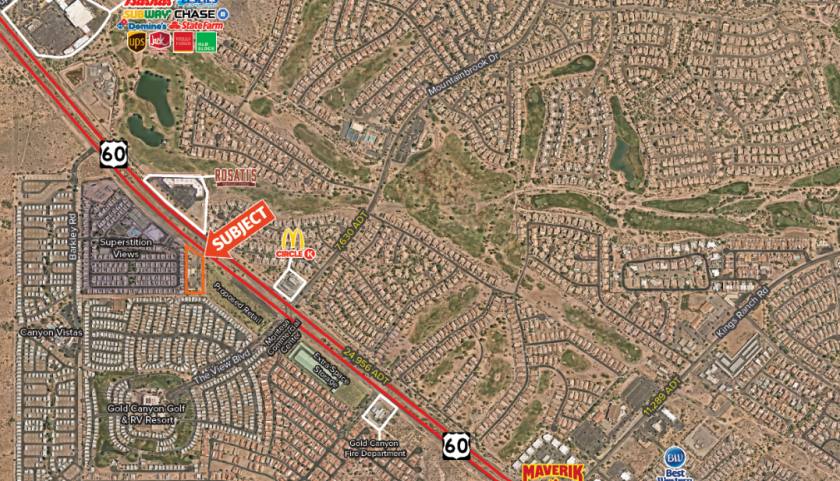
6987 U.S. 60 Gold Canyon, AZ 85118
6987 U.S. 60 Gold Canyon, AZ 85118
Details & Description
Property Highlights
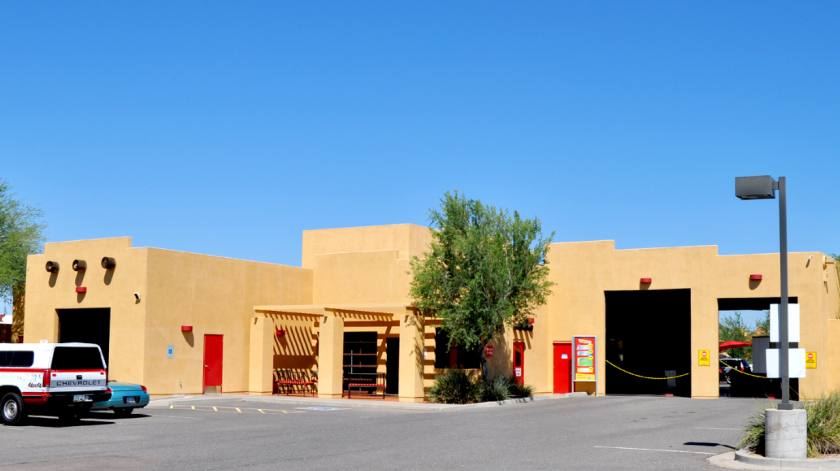
- • Year Built 2007
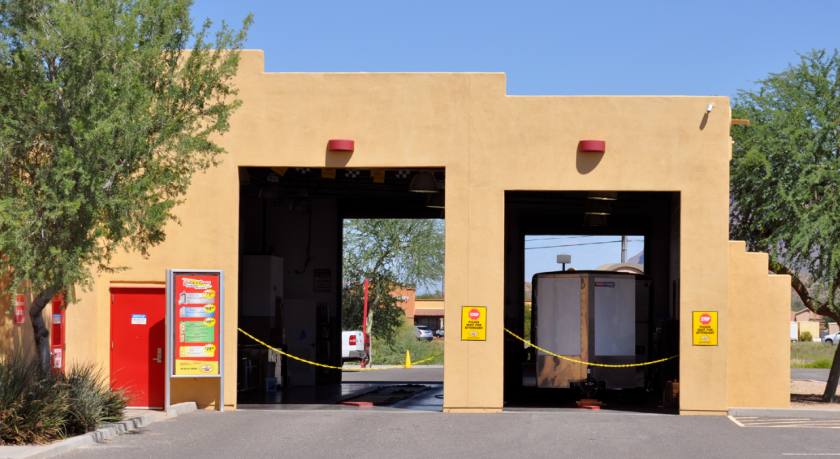
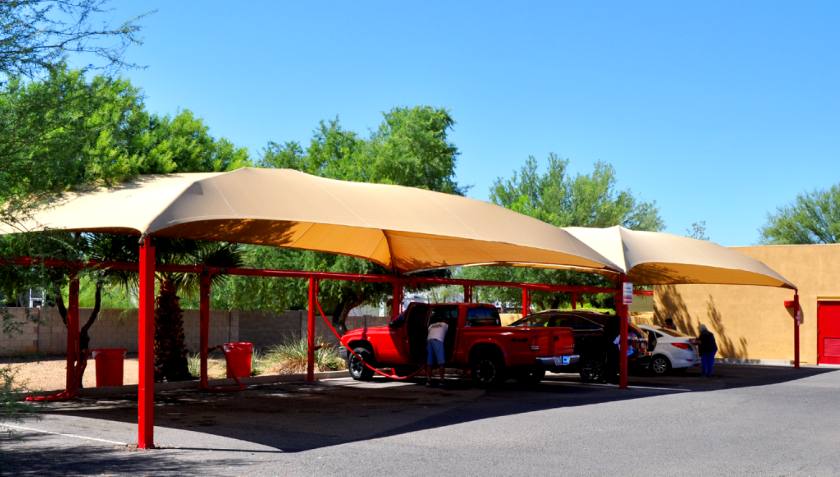
- • Only express car wash in all of Gold Canyon, AZ
- • Business for sale with real estate
- • License Agreement available to keep Quick N Clean
- • Priced well below replacement value
Additional Photos
Listing Agents

Jared Cauffield
O: 602-595-3254
jcauffield@w-retail.com
O: 602-595-3254
jcauffield@w-retail.com

Brian Gausden
O: 602-778-3740
bgausden@w-retail.com
O: 602-778-3740
bgausden@w-retail.com

Noah Anastassatos
Western Retail Advisors
M: 602-778-3747
nanastassatos@w-retail.com
Western Retail Advisors
M: 602-778-3747
nanastassatos@w-retail.com
While we strive to provide the most accurate information, all listing information, and demographic data, is provided by third-parties. As such, MyEListing will not be responsible for the accuracy of the information. It is strongly recommended that you verify all information with the listing agent, and any relevant agencies, prior to making any decisions.


