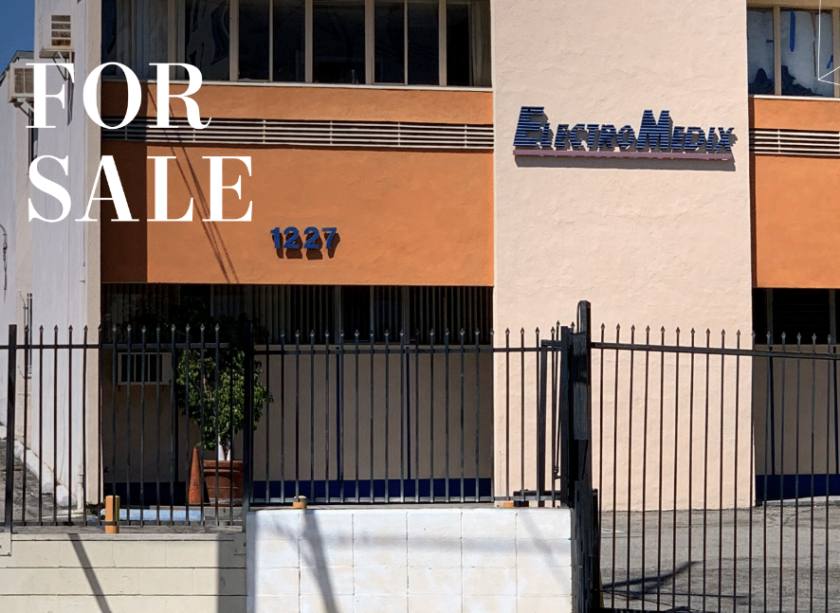
Retail Space
1227 West Temple Street Los Angeles, CA 90026
1227 West Temple Street Los Angeles, CA 90026
Details & Description
Property Highlights
- • FANTASTIC Owner User Building
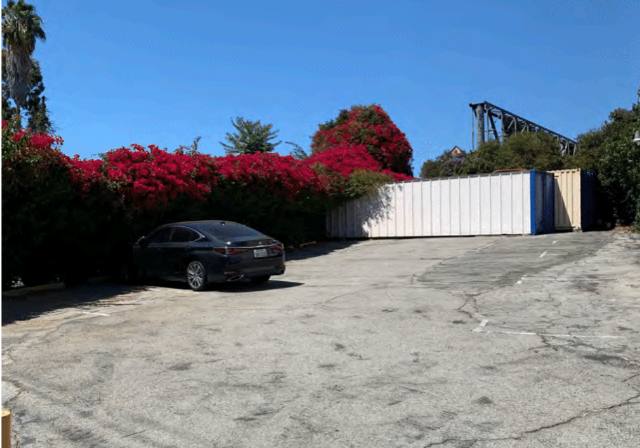
- • FENCED Gated parking lot with automated gat
- • ROOF TOP Signage can be seen from 101 Freeway
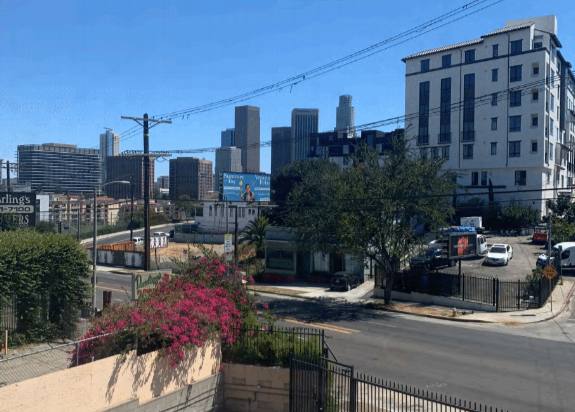
- • MINUTES AWAY from downtown LA and Hollywood
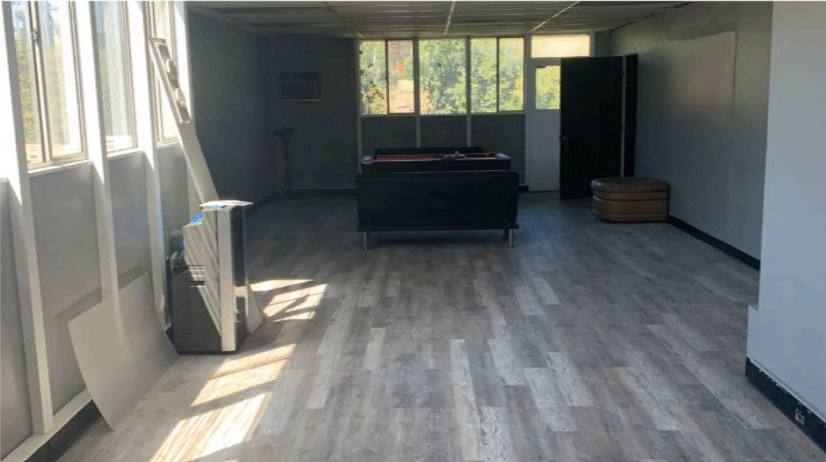
- • SECOND FLOOR features a built-out studio
- • ACCESS to 101, 110, 5 and 2 Freeways
Additional Photos

Listing Agents

John Anthony
O: 213-225-7218
M: 213-507-5570
john.anthony@kidder.com
O: 213-225-7218
M: 213-507-5570
john.anthony@kidder.com

Christopher Steck
O: 213-225-7231
christopher.steck@kidder.com
O: 213-225-7231
christopher.steck@kidder.com

Christopher Giordano
Kidder Mathews
O: 213-225-7219
christopher.giordano@kidder.com
Kidder Mathews
O: 213-225-7219
christopher.giordano@kidder.com
While we strive to provide the most accurate information, all listing information, and demographic data, is provided by third-parties. As such, MyEListing will not be responsible for the accuracy of the information. It is strongly recommended that you verify all information with the listing agent, and any relevant agencies, prior to making any decisions.


