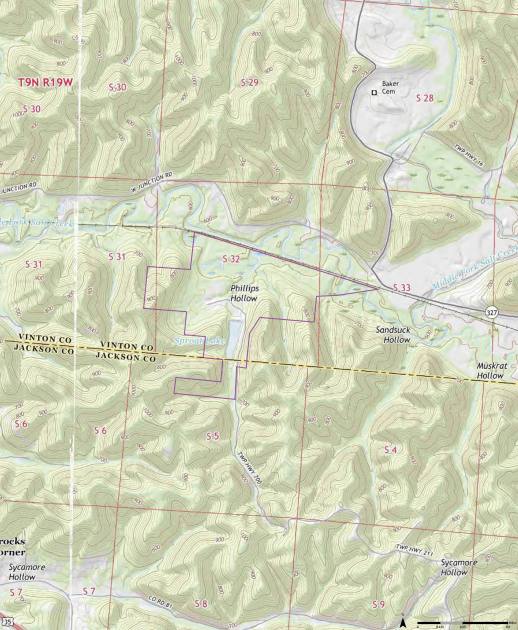
1-Mile | 3-Miles | 5-Miles | ||
---|---|---|---|---|
Total Population | 101 | 995 | 2,941 | |
Population Median Age | 40 | 39 | 39 | |
Population by Age | 0-9 Yrs | 13 (12%) | 137 (13%) | 416 (14%) |
10-19 Yrs | 11 (10%) | 123 (12%) | 397 (13%) | |
20-29 Yrs | 15 (14%) | 130 (13%) | 336 (11%) | |
30-39 Yrs | 8 (7%) | 77 (7%) | 243 (8%) | |
40-49 Yrs | 10 (9%) | 137 (13%) | 405 (13%) | |
50-59 Yrs | 22 (21%) | 167 (16%) | 475 (16%) | |
60-69 Yrs | 14 (13%) | 136 (13%) | 413 (14%) | |
70+ Yrs | 8 (7%) | 89 (8%) | 256 (8%) | |
Median HH Income | $43,792 | $43,770 | $52,279 | |
Total Household Income | < 24K | 5 (11%) | 51 (12%) | 163 (13%) |
25-49K | 17 (40%) | 169 (40%) | 416 (34%) | |
50-74K | 8 (19%) | 84 (20%) | 263 (21%) | |
75-99K | 3 (7%) | 40 (9%) | 154 (12%) | |
100-199K | 9 (21%) | 72 (17%) | 192 (16%) | |
200K+ | 0 (0%) | 3 (0%) | 9 (0%) | |
Highest Education Level | No Diploma | 14 | 92 | 239 |
Diploma or GED | 34 | 347 | 993 | |
Some College | 7 | 73 | 232 | |
Assoc. Degree | 8 | 79 | 250 | |
Bachelors Degree | 6 | 78 | 240 | |
Higher Degree | 1 | 14 | 64 | |
Total Housing Units | 47 | 473 | 1,363 | |
--Owner-Occupied | 38 | 337 | 959 | |
--Renter-Occupied | 5 | 82 | 238 | |
Owner-Occupied Values | < 100K | 18 | 129 | 336 |
100-199K | 9 | 125 | 411 | |
200-299K | 1 | 23 | 95 | |
300-399K | 8 | 56 | 111 | |
400-499K | 1 | 3 | 6 | |
500K+ | 0 | 0 | 0 | |
Total Working Age Population | 80 | 759 | 2,224 | |
In Work Force | 41 | 387 | 1,207 | |
Not In Work Force | 40 | 371 | 1,018 | |
Workforce Employed | 40 | 374 | 1,145 | |
Workforce Unemployed | 1 | 13 | 62 | |
Civlian Workforce | 41 | 387 | 1,207 | |
Military Workforce | 0 | 0 | 0 | |
Total Households | 42 | 419 | 1,197 | |
Family Households | 33 | 302 | 882 | |
Non-Family Households | 9 | 117 | 316 | |
Married Couple | 26 | 229 | 689 | |
Other Family | 7 | 73 | 193 | |
Married w/Child | 9 | 80 | 244 | |
Single Male w/Child | 3 | 17 | 34 | |
Single Female w/Child | 1 | 36 | 101 |
Population Change Last Two Decades - Plus Projection
2000 | % | 2010 | % | 2020 | % | 2030 | |
---|---|---|---|---|---|---|---|
Ohio | 11,353,140 | +2 | 11,536,504 | 0 | 11,574,870 | 0 | 11,615,100 |
Vinton County | 12,806 | +5 | 13,435 | -6 | 12,680 | -3 | 12,350 |
Pike County | 27,695 | +4 | 28,709 | +1 | 29,000 | +1 | 29,420 |
Ross County | 73,345 | +6 | 78,064 | -3 | 76,000 | 0 | 76,010 |
Jackson County | 32,641 | +2 | 33,225 | -5 | 31,600 | -3 | 30,670 |
Total Working Age Population:
Total Households:
Total Working Age Population:
Total Households:
Total Working Age Population:
Total Households: