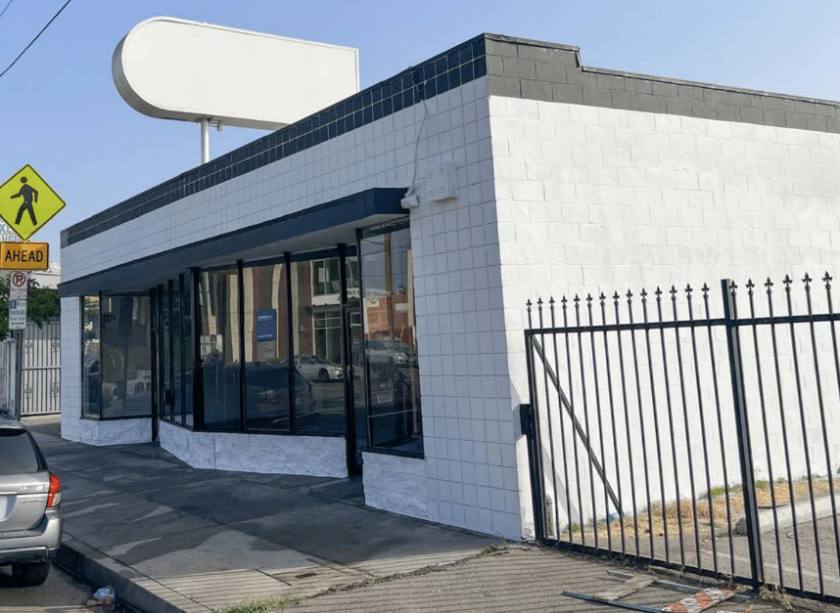
Flex-Office-Warehouse
7842-7844 Lankershim Blvd Los Angeles, CA 91605
7842-7844 Lankershim Blvd Los Angeles, CA 91605
Details & Description
Property Highlights
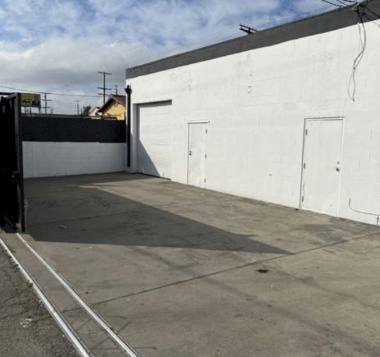
- • Parking Spaces 5 secured surface
- • Units 1-2 units possible
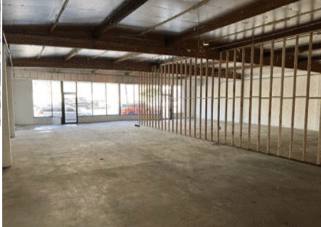
- • Ceiling Height 10.5 to low beam
- • Power Two 120–480V panels
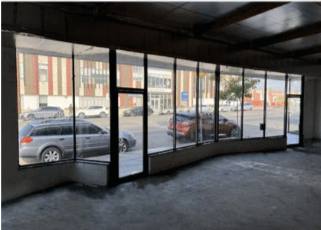
Additional Photos
Listing Agents

John Anthony
O: 213-225-7218
M: 213-507-5570
john.anthony@kidder.com
O: 213-225-7218
M: 213-507-5570
john.anthony@kidder.com

Christopher Steck
O: 213-225-7231
christopher.steck@kidder.com
O: 213-225-7231
christopher.steck@kidder.com

Christopher Giordano
Kidder Mathews
O: 213-225-7219
christopher.giordano@kidder.com
Kidder Mathews
O: 213-225-7219
christopher.giordano@kidder.com
While we strive to provide the most accurate information, all listing information, and demographic data, is provided by third-parties. As such, MyEListing will not be responsible for the accuracy of the information. It is strongly recommended that you verify all information with the listing agent, and any relevant agencies, prior to making any decisions.