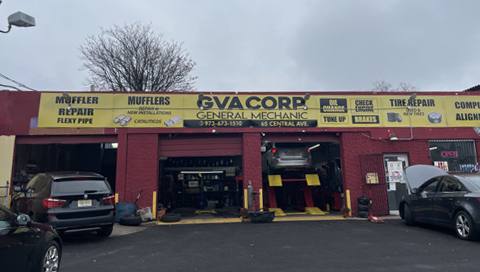
Industrial Properties
65 Central Avenue East Orange, NJ 07018
65 Central Avenue East Orange, NJ 07018
Details & Description
Property Highlights
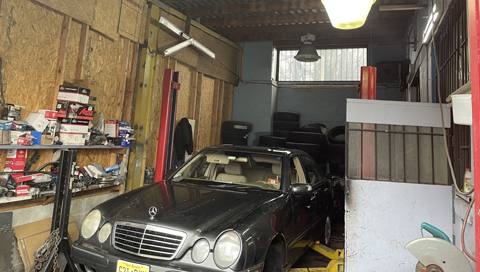
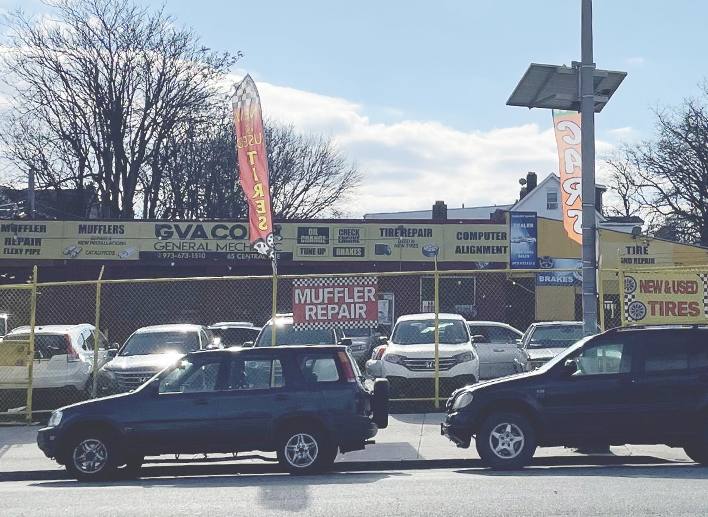
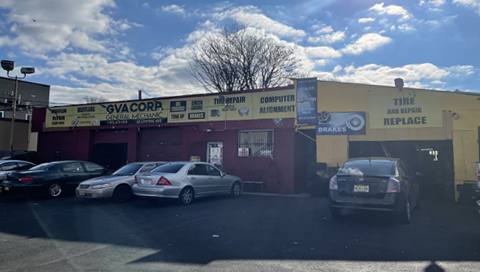
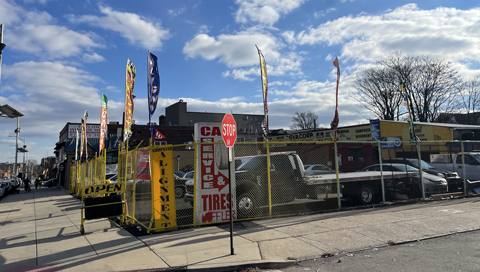
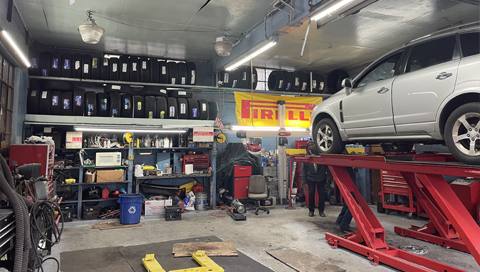
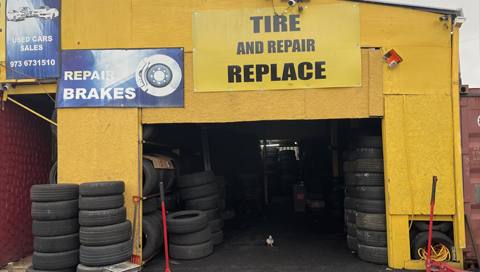
• ±3,000 SF Industrial / Retail Opportunity
• ±3,000 SF Industrial / Retail Opportunity
Additional Photos
Listing Agents

Juan Disla
O: 973-379-6644
jd@blauberg.com
O: 973-379-6644
jd@blauberg.com
While we strive to provide the most accurate information, all listing information, and demographic data, is provided by third-parties. As such, MyEListing will not be responsible for the accuracy of the information. It is strongly recommended that you verify all information with the listing agent, and any relevant agencies, prior to making any decisions.