Commercial Land
6020 River Road Bryans Road, MD 20616
6020 River Road Bryans Road, MD 20616
Details & Description
Property Highlights
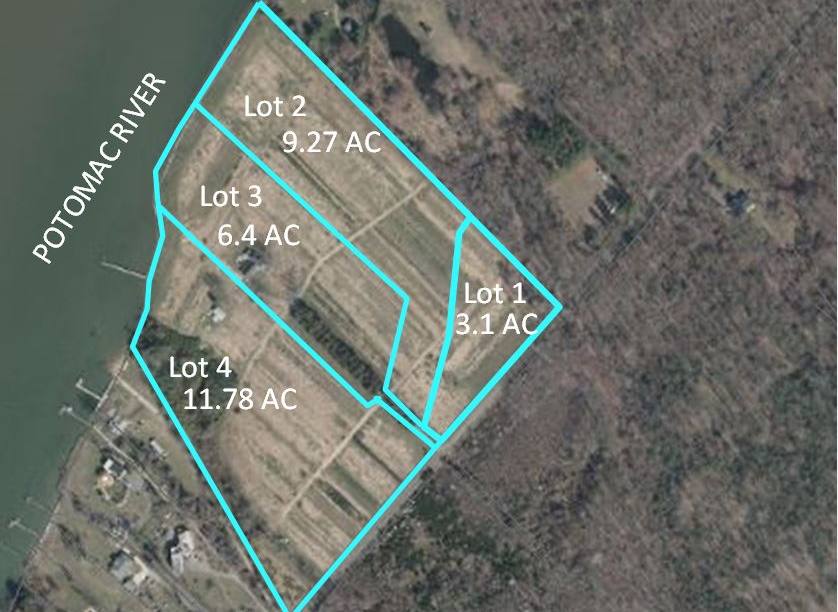
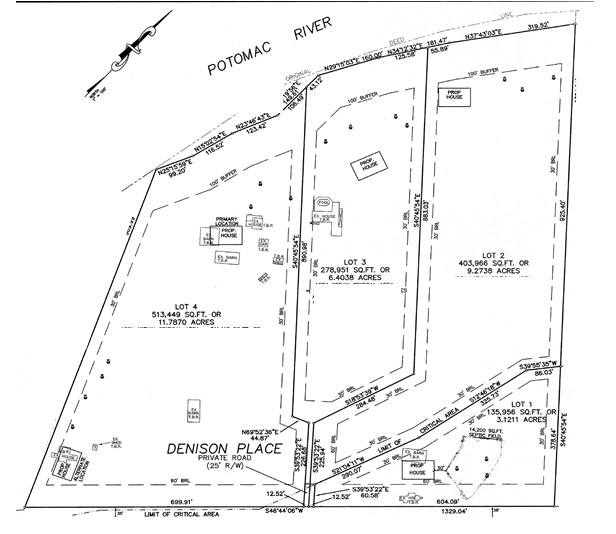
- • 4 Lots-- totaling 30.57 Acres
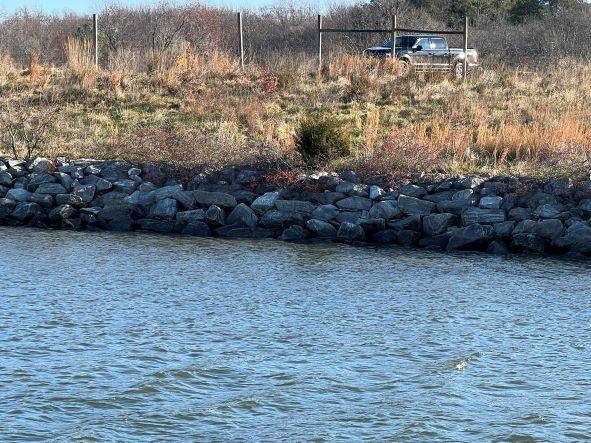
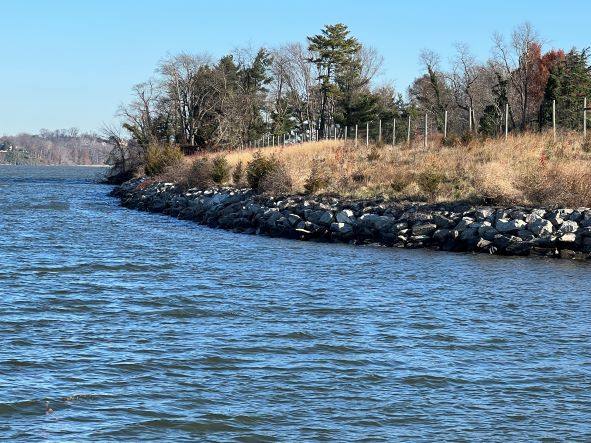
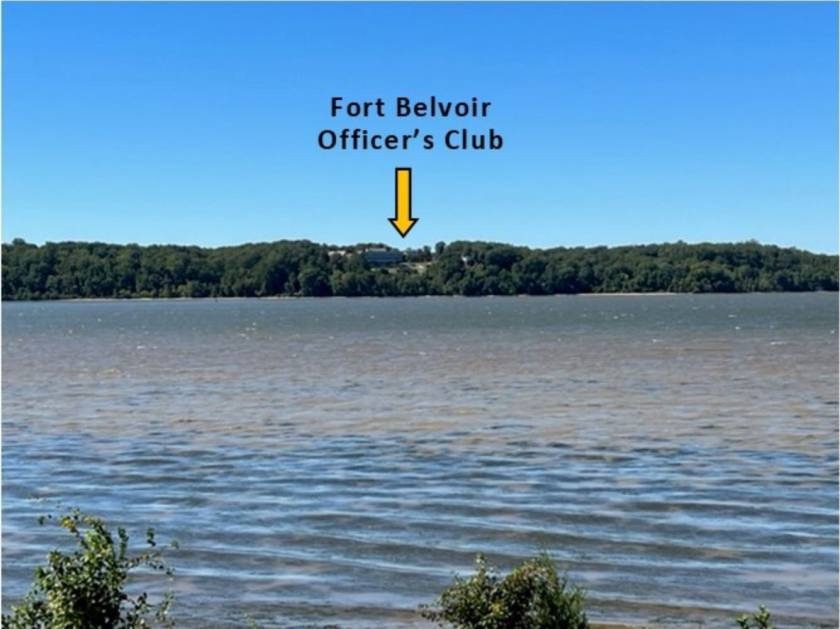
- • 3 of the Lots have waterfrontage on Potomac River
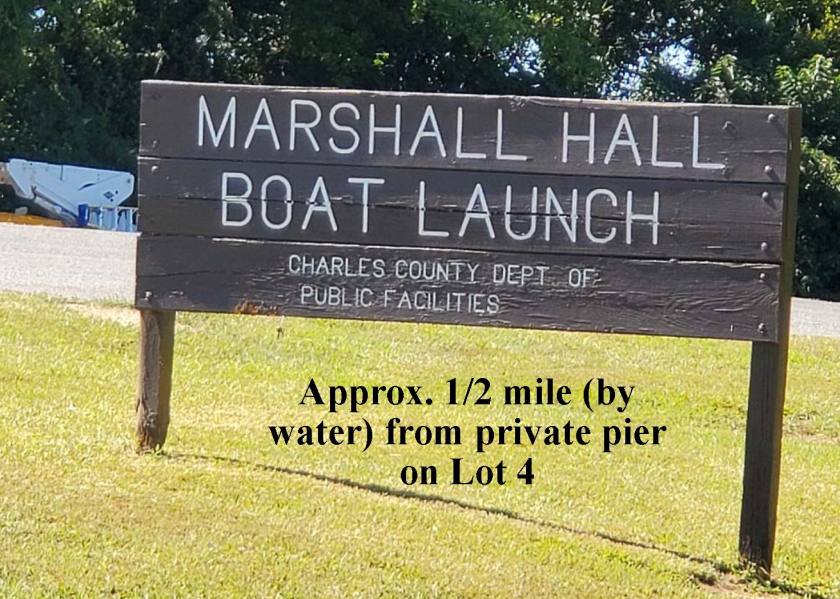
- • Lot #4 has a pier
- • Great for Family compound or Great investment
Additional Photos


Listing Agents

Leilani Lowman
O: 301-952-9700
llowman@landcommercial.com
O: 301-952-9700
llowman@landcommercial.com

Leo Bruso
leobruso@landcommercial.com
leobruso@landcommercial.com
Carrie Shearer
carrieshearer@landcommercial.com
carrieshearer@landcommercial.com
While we strive to provide the most accurate information, all listing information, and demographic data, is provided by third-parties. As such, MyEListing will not be responsible for the accuracy of the information. It is strongly recommended that you verify all information with the listing agent, and any relevant agencies, prior to making any decisions.