Commercial Land
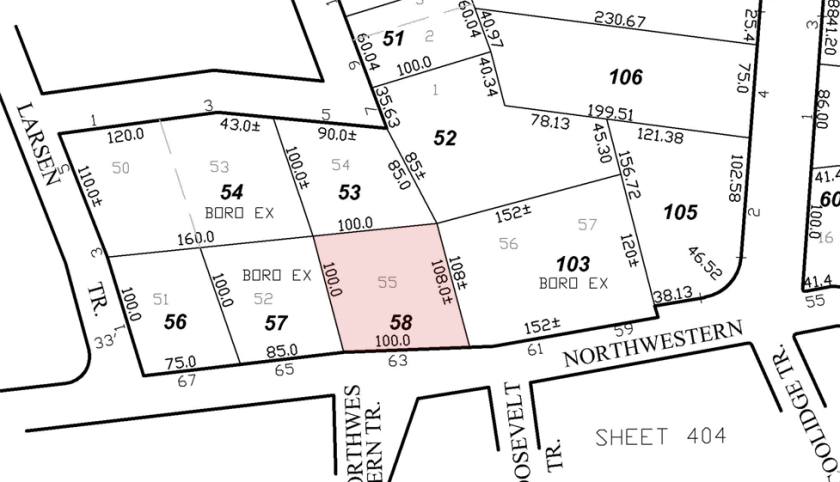
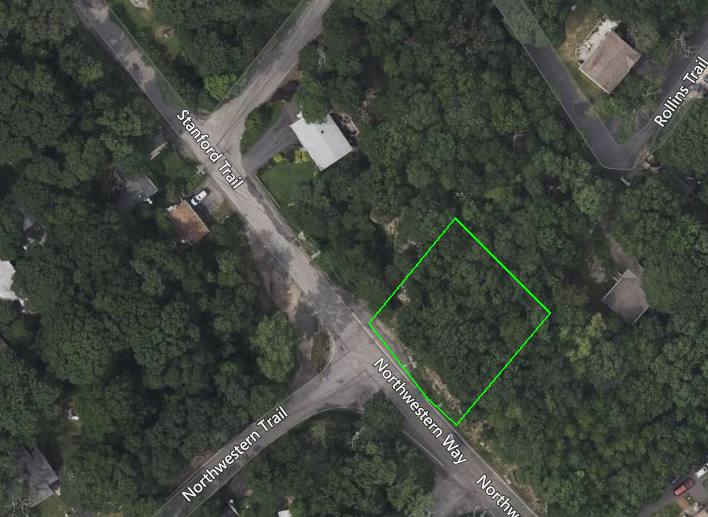
63 Northwestern Way Hopatcong, NJ 07843
63 Northwestern Way Hopatcong, NJ 07843
Details & Description
Property Highlights
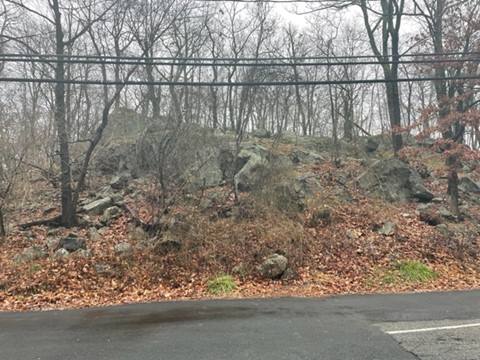
• Vacant Land
• Vacant Land
Listing Agents

Ryan Martinez
O: 973-379-6644
rmartinez@blauberg.com
O: 973-379-6644
rmartinez@blauberg.com
While we strive to provide the most accurate information, all listing information, and demographic data, is provided by third-parties. As such, MyEListing will not be responsible for the accuracy of the information. It is strongly recommended that you verify all information with the listing agent, and any relevant agencies, prior to making any decisions.