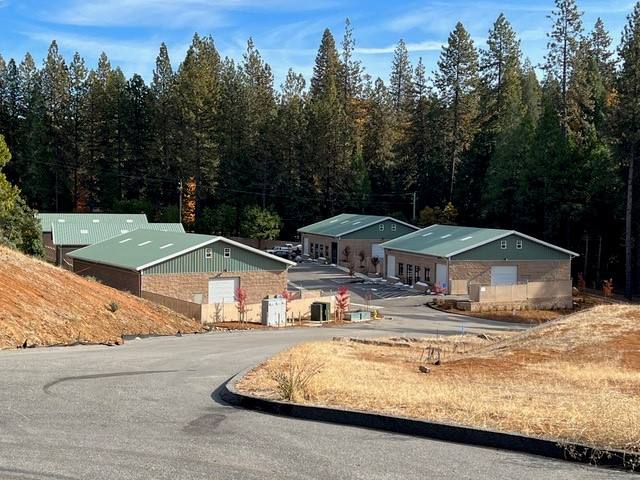
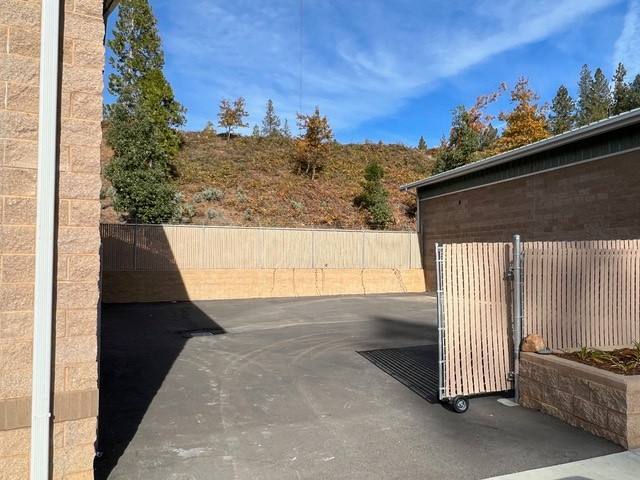
1-Mile | 3-Miles | 5-Miles | ||
---|---|---|---|---|
Total Population | 1,938 | 18,944 | 35,400 | |
Population Median Age | 47 | 47 | 47 | |
Population by Age | 0-9 Yrs | 128 (6%) | 1446 (7%) | 2928 (8%) |
10-19 Yrs | 235 (12%) | 2010 (10%) | 3511 (9%) | |
20-29 Yrs | 181 (9%) | 1834 (9%) | 3428 (9%) | |
30-39 Yrs | 209 (10%) | 2029 (10%) | 3716 (10%) | |
40-49 Yrs | 163 (8%) | 1732 (9%) | 3482 (9%) | |
50-59 Yrs | 302 (15%) | 2381 (12%) | 4594 (12%) | |
60-69 Yrs | 375 (19%) | 3551 (18%) | 6726 (19%) | |
70+ Yrs | 344 (17%) | 3961 (20%) | 7016 (19%) | |
Median HH Income | $48,345 | $49,927 | $54,816 | |
Total Household Income | < 24K | 262 (31%) | 2184 (24%) | 3346 (21%) |
25-49K | 164 (19%) | 2200 (25%) | 3932 (25%) | |
50-74K | 161 (19%) | 1597 (18%) | 2785 (17%) | |
75-99K | 94 (11%) | 902 (10%) | 1724 (10%) | |
100-199K | 117 (13%) | 1354 (15%) | 2883 (18%) | |
200K+ | 47 (5%) | 518 (5%) | 1054 (6%) | |
Highest Education Level | No Diploma | 118 | 1030 | 1628 |
Diploma or GED | 319 | 3216 | 5477 | |
Some College | 438 | 4184 | 7937 | |
Assoc. Degree | 144 | 1274 | 2763 | |
Bachelors Degree | 304 | 3079 | 5757 | |
Higher Degree | 157 | 1818 | 3712 | |
Total Housing Units | 914 | 9,823 | 17,479 | |
--Owner-Occupied | 439 | 4,555 | 9,570 | |
--Renter-Occupied | 406 | 4,200 | 6,155 | |
Owner-Occupied Values | < 100K | 68 | 462 | 1082 |
100-199K | 3 | 76 | 321 | |
200-299K | 30 | 594 | 1118 | |
300-399K | 122 | 1352 | 2657 | |
400-499K | 63 | 696 | 1512 | |
500K+ | 154 | 1374 | 2879 | |
Total Working Age Population | 1,662 | 16,284 | 30,346 | |
In Work Force | 795 | 8,253 | 16,115 | |
Not In Work Force | 867 | 8,031 | 14,232 | |
Workforce Employed | 775 | 7,964 | 15,533 | |
Workforce Unemployed | 20 | 264 | 526 | |
Civlian Workforce | 795 | 8,228 | 16,059 | |
Military Workforce | 0 | 25 | 56 | |
Total Households | 845 | 8,755 | 15,725 | |
Family Households | 490 | 4,474 | 8,545 | |
Non-Family Households | 355 | 4,281 | 7,181 | |
Married Couple | 301 | 2,999 | 6,093 | |
Other Family | 189 | 1,475 | 2,452 | |
Married w/Child | 74 | 802 | 1,583 | |
Single Male w/Child | 8 | 92 | 286 | |
Single Female w/Child | 97 | 753 | 979 |
Population Change Last Two Decades - Plus Projection
2000 | % | 2010 | % | 2020 | % | 2030 | |
---|---|---|---|---|---|---|---|
California | 33,871,648 | +10 | 37,253,956 | +9 | 40,467,295 | +8 | 43,631,295 |
Nevada County | 92,033 | +7 | 98,764 | +1 | 99,578 | +6 | 105,214 |
Total Working Age Population:
Total Households:
Total Working Age Population:
Total Households:
Total Working Age Population:
Total Households: