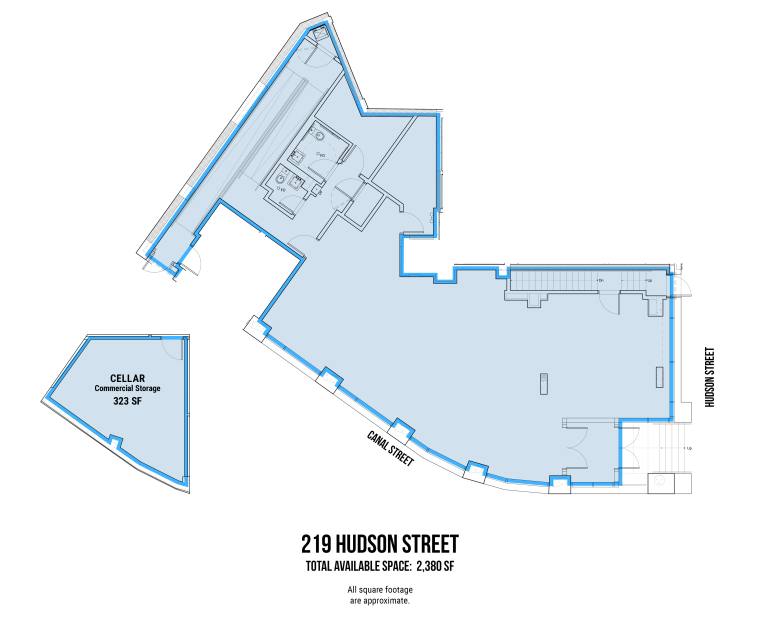
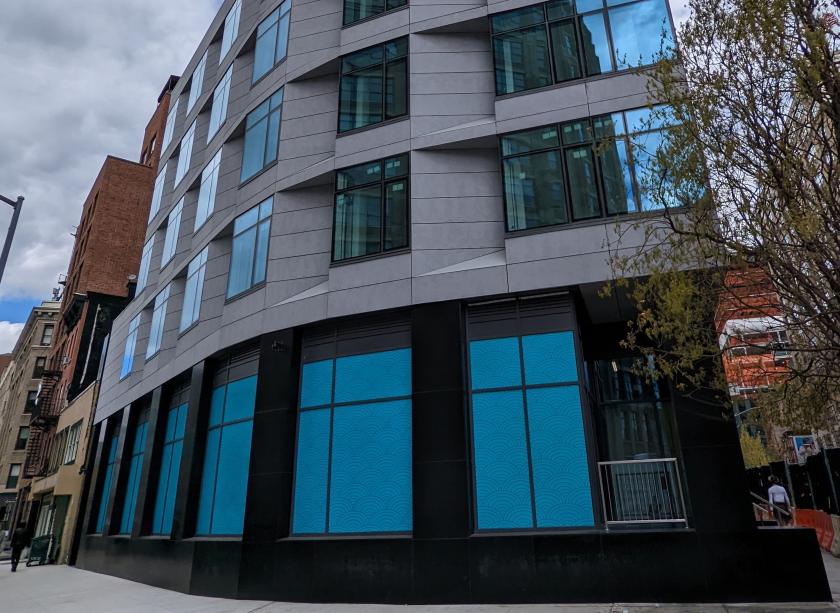
1-Mile | 3-Miles | 5-Miles | ||
---|---|---|---|---|
Total Population | 137,599 | 938,024 | 2,259,401 | |
Population Median Age | 40 | 38 | 38 | |
Population by Age | 0-9 Yrs | 10614 (7%) | 83970 (8%) | 238175 (10%) |
10-19 Yrs | 9448 (6%) | 67623 (7%) | 185305 (8%) | |
20-29 Yrs | 25389 (18%) | 190820 (20%) | 406994 (18%) | |
30-39 Yrs | 28875 (20%) | 210305 (22%) | 472845 (20%) | |
40-49 Yrs | 18377 (13%) | 122448 (13%) | 294422 (13%) | |
50-59 Yrs | 15750 (11%) | 96267 (10%) | 244882 (10%) | |
60-69 Yrs | 14134 (10%) | 81587 (8%) | 200019 (8%) | |
70+ Yrs | 15011 (10%) | 85003 (9%) | 216760 (9%) | |
Median HH Income | $124,780 | $109,634 | $97,567 | |
Total Household Income | < 24K | 9601 (14%) | 77308 (17%) | 178130 (17%) |
25-49K | 6937 (10%) | 52557 (11%) | 131647 (12%) | |
50-74K | 5780 (8%) | 41992 (9%) | 112406 (10%) | |
75-99K | 5502 (8%) | 40496 (8%) | 99060 (9%) | |
100-199K | 16198 (24%) | 117939 (26%) | 261330 (25%) | |
200K+ | 22630 (33%) | 122915 (27%) | 240648 (23%) | |
Highest Education Level | No Diploma | 11023 | 70543 | 180810 |
Diploma or GED | 7831 | 75567 | 238084 | |
Some College | 6369 | 58375 | 157958 | |
Assoc. Degree | 2999 | 21828 | 65246 | |
Bachelors Degree | 44392 | 273157 | 568048 | |
Higher Degree | 35826 | 221832 | 487096 | |
Total Housing Units | 78,895 | 518,708 | 1,175,744 | |
--Owner-Occupied | 17,016 | 111,102 | 276,979 | |
--Renter-Occupied | 49,632 | 342,107 | 746,243 | |
Owner-Occupied Values | < 100K | 344 | 4174 | 8253 |
100-199K | 302 | 3141 | 7285 | |
200-299K | 320 | 3829 | 12779 | |
300-399K | 226 | 5574 | 17866 | |
400-499K | 552 | 6669 | 18071 | |
500K+ | 15273 | 87714 | 212725 | |
Total Working Age Population | 122,402 | 818,210 | 1,909,648 | |
In Work Force | 85,369 | 584,247 | 1,345,051 | |
Not In Work Force | 37,034 | 233,963 | 564,597 | |
Workforce Employed | 81,426 | 558,272 | 1,275,713 | |
Workforce Unemployed | 3,927 | 25,738 | 68,774 | |
Civlian Workforce | 85,354 | 584,010 | 1,344,487 | |
Military Workforce | 15 | 236 | 564 | |
Total Households | 66,648 | 453,209 | 1,023,221 | |
Family Households | 26,841 | 184,573 | 476,090 | |
Non-Family Households | 39,806 | 268,635 | 547,131 | |
Married Couple | 21,795 | 138,407 | 338,386 | |
Other Family | 5,047 | 46,167 | 137,704 | |
Married w/Child | 7,733 | 52,481 | 136,829 | |
Single Male w/Child | 645 | 3,987 | 11,784 | |
Single Female w/Child | 1,279 | 14,462 | 44,349 |
Population Change Last Two Decades - Plus Projection
2000 | % | 2010 | % | 2020 | % | 2030 | |
---|---|---|---|---|---|---|---|
New Jersey | 8,414,350 | +4 | 8,791,894 | +4 | 9,132,700 | +4 | 9,530,900 |
Hudson County | 608,975 | +4 | 634,266 | +12 | 708,100 | +6 | 747,400 |
New York | 18,976,457 | +2 | 19,378,102 | +4 | 20,146,131 | +2 | 20,604,030 |
Queens County | 2,229,379 | 0 | 2,230,722 | +9 | 2,436,549 | +5 | 2,565,268 |
Kings County | 2,465,326 | +2 | 2,504,700 | +9 | 2,738,283 | +5 | 2,863,996 |
New York County | 1,537,195 | +3 | 1,585,873 | +6 | 1,688,894 | +2 | 1,727,631 |
Total Working Age Population:
Total Households:
Total Working Age Population:
Total Households:
Total Working Age Population:
Total Households: