Commercial Land
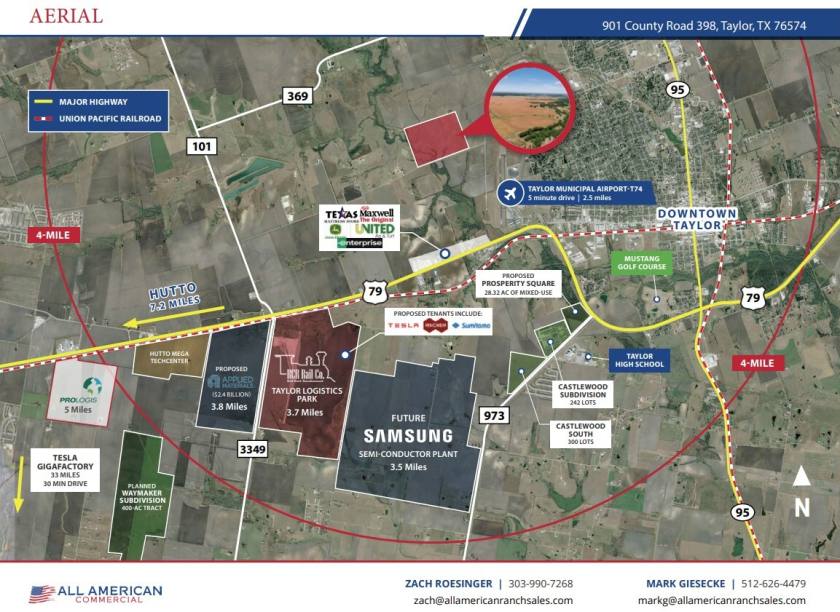
901 County Road 398 Taylor, TX 76574
901 County Road 398 Taylor, TX 76574
Details & Description
Property Highlights
• Amazing land-hold play - with Samsung's $17B fabrication facility going vertical it's only a matter of time
• Perfect for a tech campus, office park, light-industrial warehousing, Samsung parts supplier
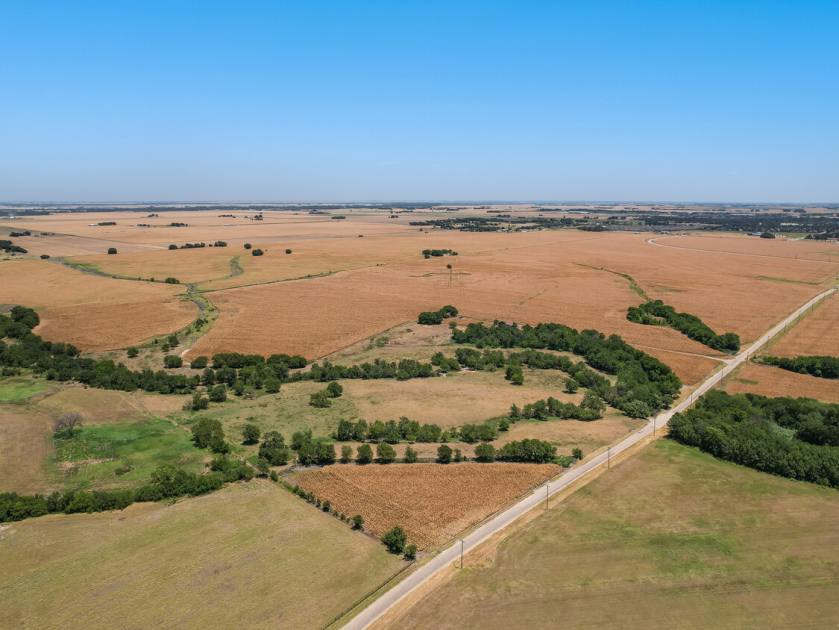
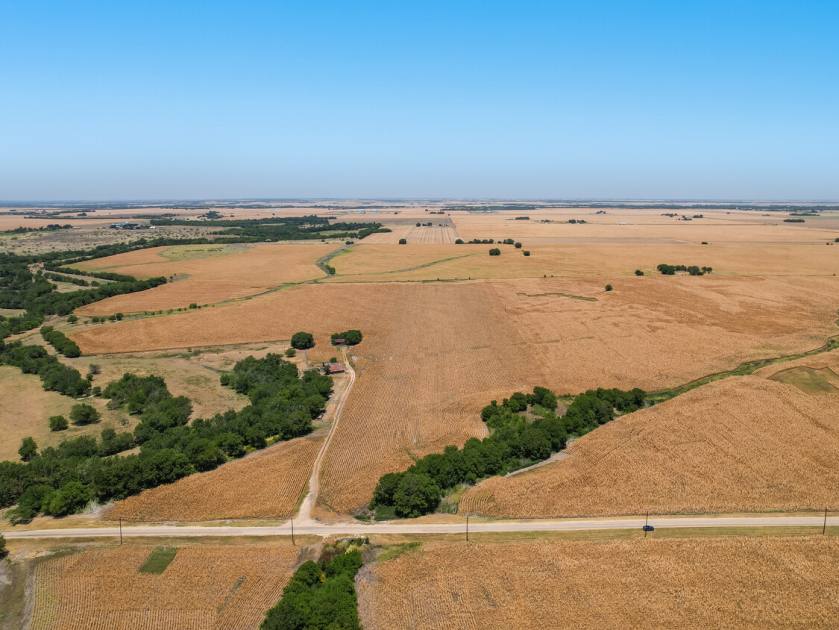
Additional Photos

Listing Agents

Zach Roesinger
O: 512-949-1418
M: 512-949-1418
zroesinger@resolutre.com
O: 512-949-1418
M: 512-949-1418
zroesinger@resolutre.com
While we strive to provide the most accurate information, all listing information, and demographic data, is provided by third-parties. As such, MyEListing will not be responsible for the accuracy of the information. It is strongly recommended that you verify all information with the listing agent, and any relevant agencies, prior to making any decisions.


