Commercial Land
628 U.S. 22 Hillside, NJ 07205
628 U.S. 22 Hillside, NJ 07205

Details & Description
Property Highlights
• one unit is currently being razed. total frontage on Rt. 22 is 150 feet. total taxes on the package total $28000.00
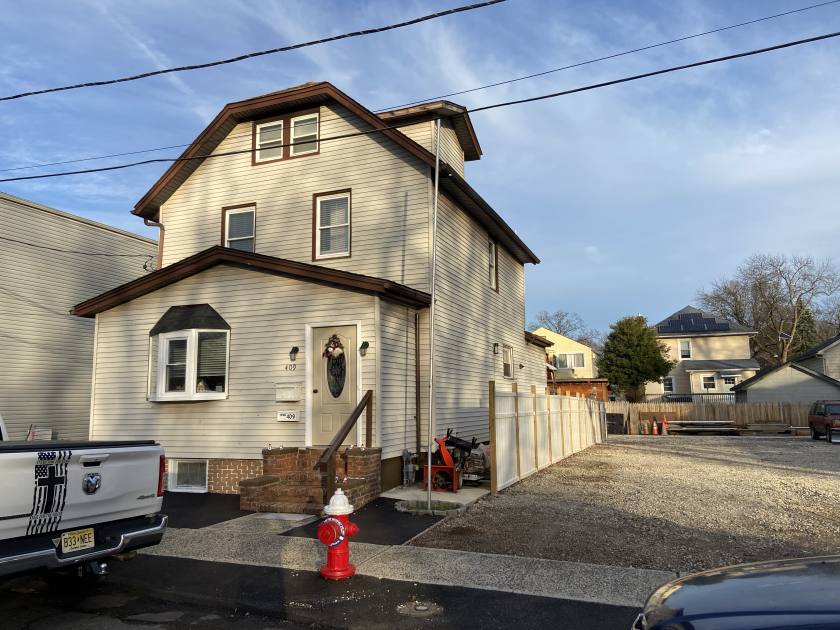
• 4 package property including a vacant lot, 2 single family homes and a newly constructed 2 car garage.
Additional Photos


Listing Agents

Joseph Menza
O: 973-926-2400
M: 973-699-0222
jgmenzarealty@aol.com
O: 973-926-2400
M: 973-699-0222
jgmenzarealty@aol.com
While we strive to provide the most accurate information, all listing information, and demographic data, is provided by third-parties. As such, MyEListing will not be responsible for the accuracy of the information. It is strongly recommended that you verify all information with the listing agent, and any relevant agencies, prior to making any decisions.


