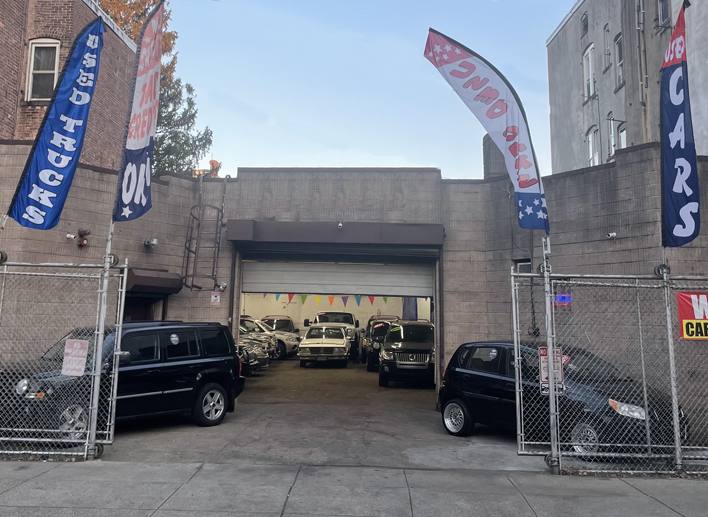
Currently used as indoor used car dealership licensed by the DMV
Can be used for auto repairs, bodywork and also a great building for contractor
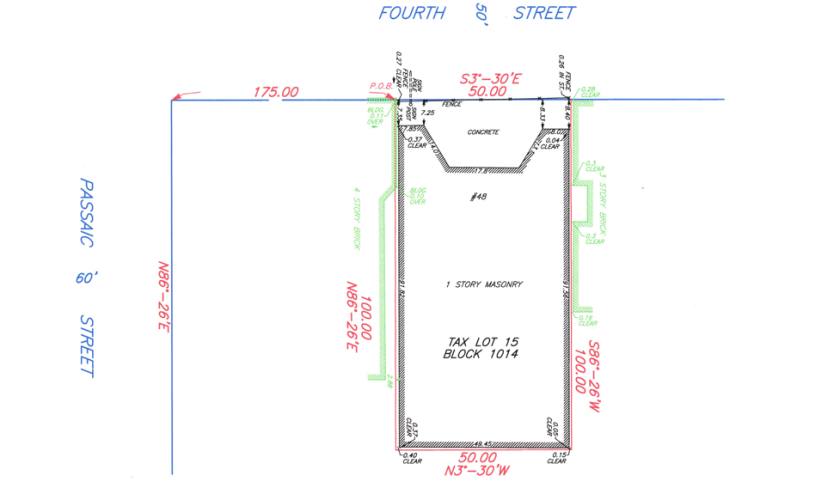
Work area is 48'× 100' open span with steel beam overhead construction
14' × 10' office, separate bathroom, small basement
Features 12' ceilings, 10' drive-in door, 200 amp service
Possible redevelopment opportunity as property is located in a highly residential area
Lot size at ±0.11 acres (Block 1014, Lot 15)
Zoned R3
Taxes at $5,809.20 (2022)
Approx. 1.3 Miles to Route 21
Approx. 7.3 Miles to NJ Turnpike
Approx. 6 Miles to Garden State Parkway Exit 153B
Approx. 10 Miles to I-80
No part of this information may be copied, reproduced, repurposed, or screen-captured for any commercial purpose without prior written authorization from MyEListing.
While we strive to provide the most accurate information, all listing information, and demographic data, is provided by third-parties. As such, MyEListing will not be responsible for the accuracy of the information. It is strongly recommended that you verify all information with the listing agent, and any relevant agencies, prior to making any decisions.
What is the building size of this Industrial property in Passaic, NJ?
The size of the building/unit at 46 4th Street in Passaic is 5,000 square feet
How much land does the Passaic, NJ property at 46 4th Street include?
46 4th Street in Passaic includes 0.110 acres of land
What kind of Industrial is the propery at 46 4th Street?
The property at 46 4th Street Passaic, NJ 07055 is listed as a Other Industrial Industrial property
What is the population within 1 mile of 46 4th Street in Passaic?
The population within 1 mile of 46 4th Street Passaic, NJ 07055 is 60,084 people.
Who do I contact for questions about 46 4th Street?
You should contact the listing agent,
Juan Disla, for any details regarding this commercial listing.