Retail Space
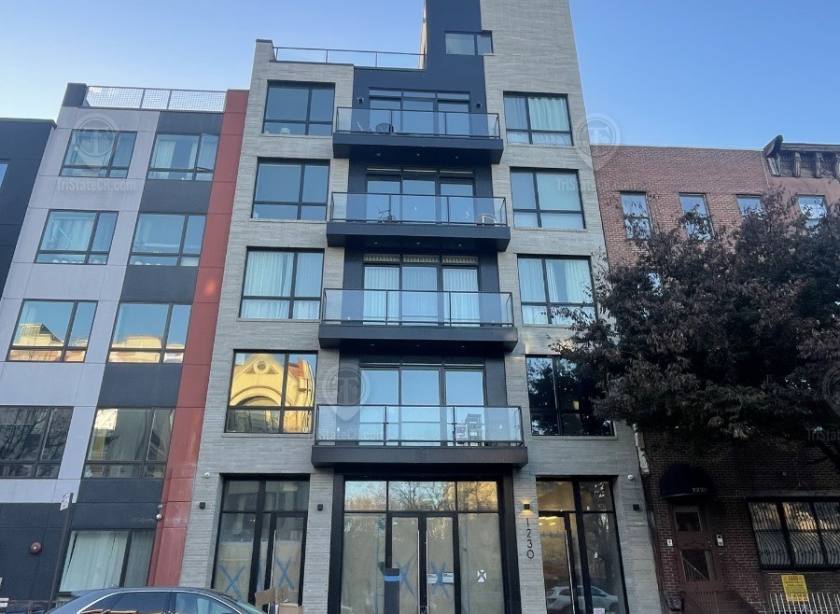
1230 Bedford Avenue Brooklyn, NY 11216
1230 Bedford Avenue Brooklyn, NY 11216
Details & Description
Property Highlights
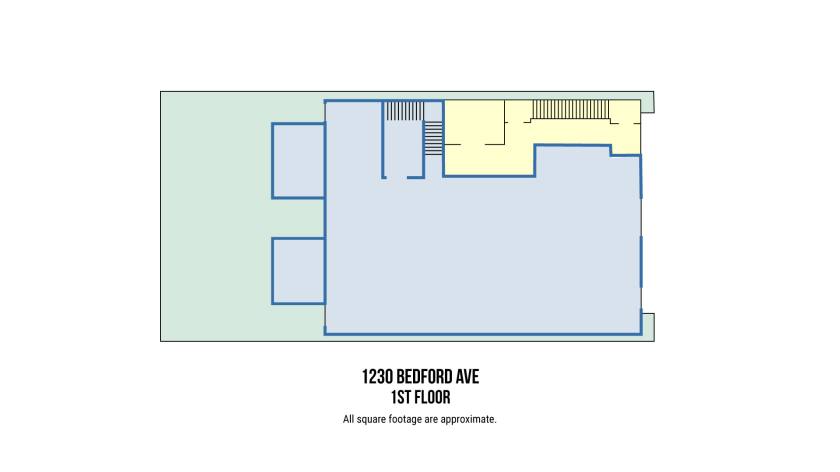
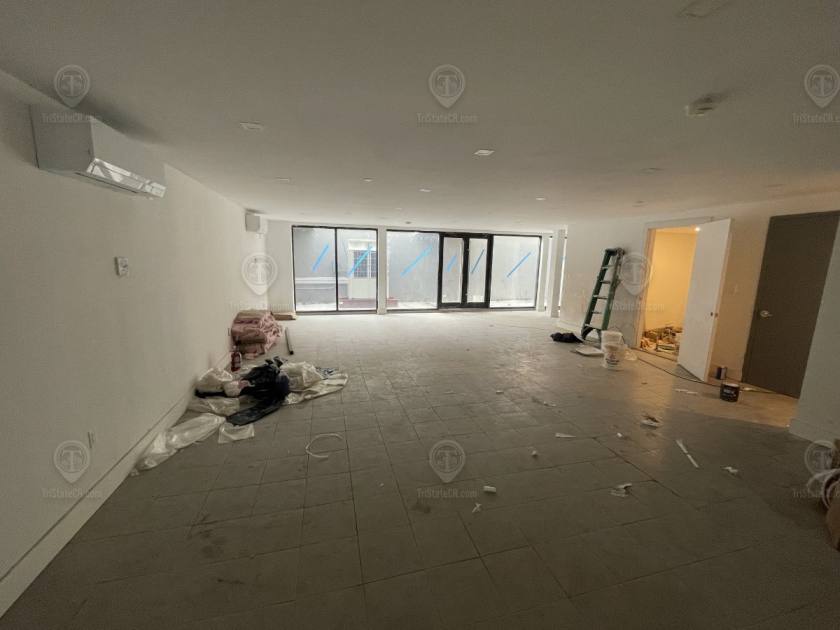
- • Ground: 1,700 SF + backyard
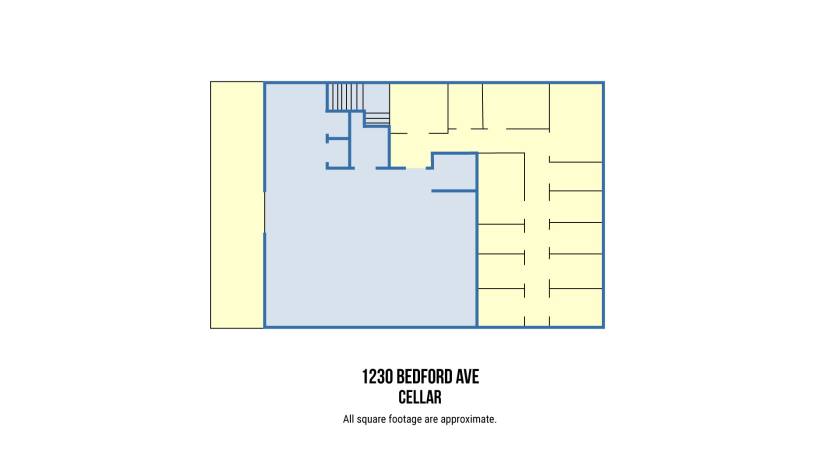
- • Lower level: 1,100 SF + backyard
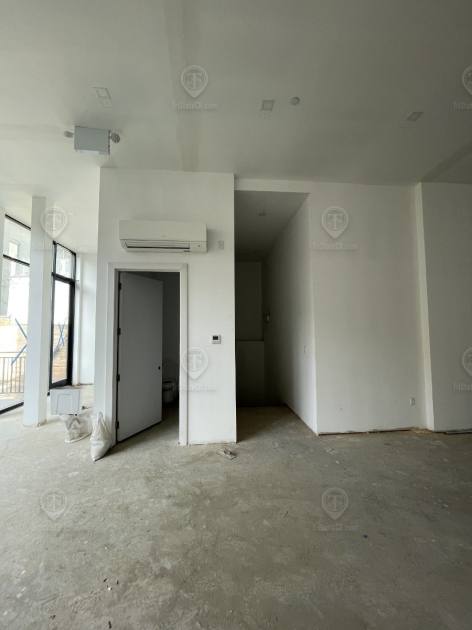
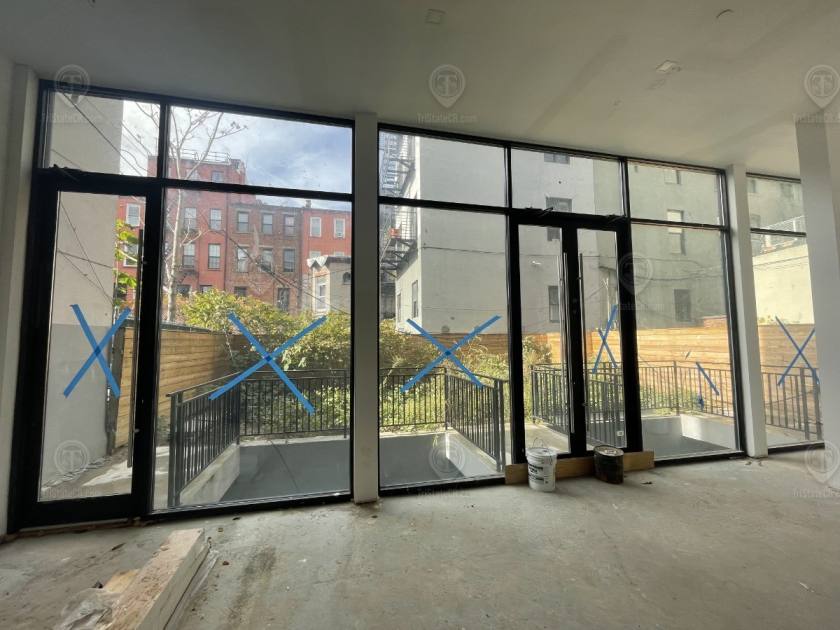
- • Glass curtain wall in the lower level
- • Sellable lower level
- • Vanilla Boxed
- • Split units in place
Additional Photos


Listing Agents

Shlomi Bagdadi
O: 718-437-6100
info@tristatecr.com
O: 718-437-6100
info@tristatecr.com
While we strive to provide the most accurate information, all listing information, and demographic data, is provided by third-parties. As such, MyEListing will not be responsible for the accuracy of the information. It is strongly recommended that you verify all information with the listing agent, and any relevant agencies, prior to making any decisions.