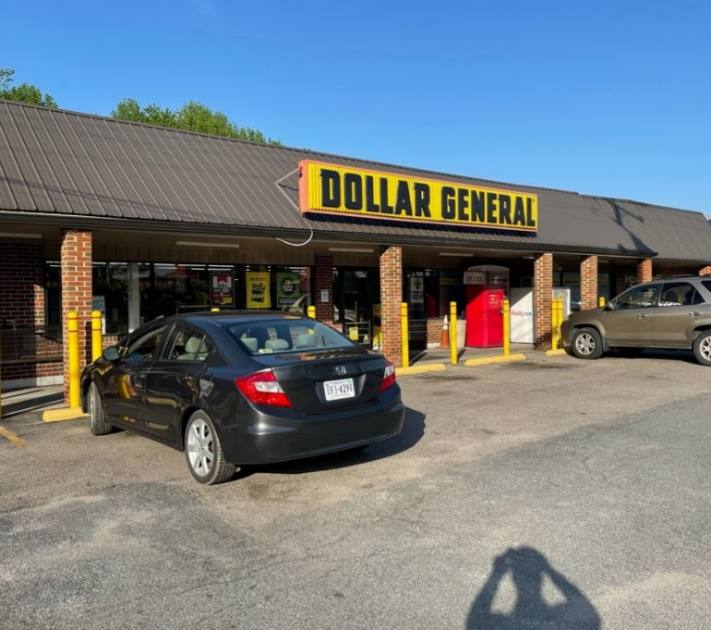
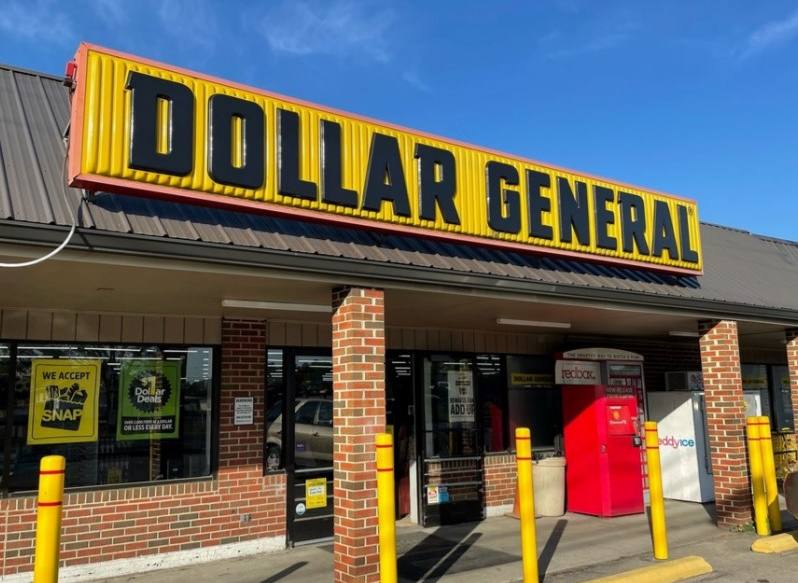
1-Mile | 3-Miles | 5-Miles | ||
---|---|---|---|---|
Total Population | 314 | 2,266 | 3,763 | |
Population Median Age | 35 | 37 | 38 | |
Population by Age | 0-9 Yrs | 56 (17%) | 346 (15%) | 461 (12%) |
10-19 Yrs | 39 (12%) | 287 (12%) | 451 (11%) | |
20-29 Yrs | 52 (16%) | 359 (15%) | 624 (16%) | |
30-39 Yrs | 40 (12%) | 296 (13%) | 490 (13%) | |
40-49 Yrs | 35 (11%) | 273 (12%) | 510 (13%) | |
50-59 Yrs | 33 (10%) | 249 (10%) | 427 (11%) | |
60-69 Yrs | 35 (11%) | 237 (10%) | 400 (10%) | |
70+ Yrs | 25 (7%) | 218 (9%) | 399 (10%) | |
Median HH Income | $51,067 | $51,816 | $54,359 | |
Total Household Income | < 24K | 19 (19%) | 145 (19%) | 237 (18%) |
25-49K | 29 (28%) | 214 (28%) | 326 (25%) | |
50-74K | 30 (30%) | 200 (26%) | 290 (22%) | |
75-99K | 10 (10%) | 98 (12%) | 179 (14%) | |
100-199K | 11 (11%) | 89 (11%) | 205 (16%) | |
200K+ | 1 (1%) | 13 (1%) | 26 (2%) | |
Highest Education Level | No Diploma | 32 | 260 | 455 |
Diploma or GED | 74 | 553 | 980 | |
Some College | 40 | 267 | 458 | |
Assoc. Degree | 13 | 108 | 181 | |
Bachelors Degree | 19 | 155 | 272 | |
Higher Degree | 6 | 49 | 111 | |
Total Housing Units | 132 | 967 | 1,571 | |
--Owner-Occupied | 61 | 476 | 825 | |
--Renter-Occupied | 40 | 283 | 439 | |
Owner-Occupied Values | < 100K | 35 | 279 | 398 |
100-199K | 18 | 125 | 270 | |
200-299K | 4 | 42 | 97 | |
300-399K | 1 | 11 | 22 | |
400-499K | 2 | 14 | 18 | |
500K+ | 0 | 6 | 19 | |
Total Working Age Population | 234 | 1,743 | 3,034 | |
In Work Force | 142 | 1,077 | 1,826 | |
Not In Work Force | 91 | 667 | 1,208 | |
Workforce Employed | 120 | 943 | 1,637 | |
Workforce Unemployed | 22 | 132 | 185 | |
Civlian Workforce | 142 | 1,075 | 1,822 | |
Military Workforce | 0 | 2 | 4 | |
Total Households | 100 | 759 | 1,264 | |
Family Households | 68 | 516 | 865 | |
Non-Family Households | 32 | 243 | 399 | |
Married Couple | 45 | 323 | 573 | |
Other Family | 23 | 193 | 292 | |
Married w/Child | 19 | 128 | 218 | |
Single Male w/Child | 4 | 50 | 75 | |
Single Female w/Child | 10 | 75 | 106 |
Population Change Last Two Decades - Plus Projection
2000 | % | 2010 | % | 2020 | % | 2030 | |
---|---|---|---|---|---|---|---|
Virginia | 7,078,515 | +13 | 8,001,024 | +8 | 8,655,021 | +8 | 9,331,666 |
Surry County | 6,829 | +3 | 7,058 | -8 | 6,501 | -3 | 6,282 |
Sussex County | 12,504 | -3 | 12,087 | -6 | 11,370 | -6 | 10,657 |
Total Working Age Population:
Total Households:
Total Working Age Population:
Total Households:
Total Working Age Population:
Total Households: