Industrial Properties
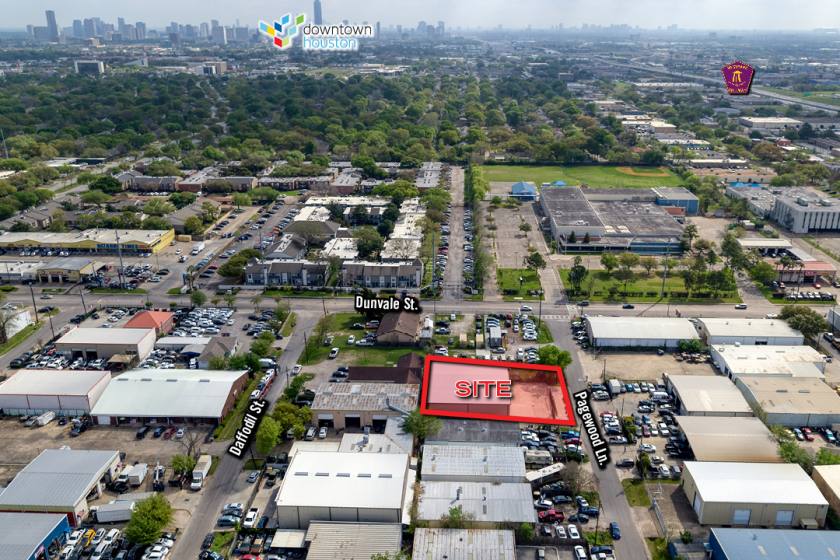
8614 Pagewood Lane Houston, TX 77063
8614 Pagewood Lane Houston, TX 77063

Details & Description
Property Highlights
- • New Construction
- • 3 Phase 240 Volt 200 Amp Electrical Service
- • Motion Sensor LED Lighting in Warehouse
- • 4 Overhead Doors & 2 Entrance Gates
- • Easy Westpark Tollway Access
Additional Photos


Listing Agents

Cotton Munson
O: 832-804-8041
cotton@davis-commercial.com
O: 832-804-8041
cotton@davis-commercial.com
While we strive to provide the most accurate information, all listing information, and demographic data, is provided by third-parties. As such, MyEListing will not be responsible for the accuracy of the information. It is strongly recommended that you verify all information with the listing agent, and any relevant agencies, prior to making any decisions.


