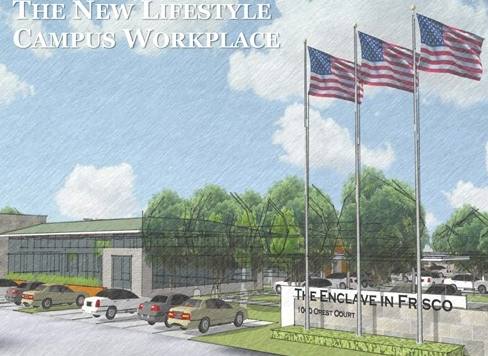
1-Mile | 3-Miles | 5-Miles | ||
---|---|---|---|---|
Total Population | 7,274 | 88,971 | 269,518 | |
Population Median Age | 37 | 35 | 37 | |
Population by Age | 0-9 Yrs | 698 (9%) | 10625 (11%) | 32986 (12%) |
10-19 Yrs | 512 (7%) | 10804 (12%) | 36432 (13%) | |
20-29 Yrs | 1658 (22%) | 14521 (16%) | 33304 (12%) | |
30-39 Yrs | 1445 (19%) | 15796 (17%) | 41524 (15%) | |
40-49 Yrs | 922 (12%) | 14623 (16%) | 45148 (16%) | |
50-59 Yrs | 888 (12%) | 11563 (12%) | 38220 (14%) | |
60-69 Yrs | 760 (10%) | 6858 (7%) | 24342 (9%) | |
70+ Yrs | 391 (5%) | 4181 (4%) | 17563 (6%) | |
Median HH Income | $75,589 | $97,341 | $107,057 | |
Total Household Income | < 24K | 272 (6%) | 2889 (7%) | 8070 (7%) |
25-49K | 836 (21%) | 5181 (13%) | 12545 (12%) | |
50-74K | 855 (21%) | 5671 (14%) | 13873 (13%) | |
75-99K | 544 (13%) | 5803 (15%) | 13725 (13%) | |
100-199K | 822 (20%) | 12123 (32%) | 34506 (33%) | |
200K+ | 624 (15%) | 6188 (16%) | 20893 (20%) | |
Highest Education Level | No Diploma | 97 | 2204 | 7237 |
Diploma or GED | 452 | 6724 | 20895 | |
Some College | 1042 | 9675 | 30290 | |
Assoc. Degree | 267 | 3998 | 11748 | |
Bachelors Degree | 2359 | 24960 | 70230 | |
Higher Degree | 1161 | 14773 | 45065 | |
Total Housing Units | 4,504 | 41,238 | 111,001 | |
--Owner-Occupied | 907 | 15,946 | 59,736 | |
--Renter-Occupied | 3,045 | 21,909 | 43,876 | |
Owner-Occupied Values | < 100K | 0 | 350 | 1025 |
100-199K | 17 | 1356 | 4506 | |
200-299K | 0 | 2919 | 11399 | |
300-399K | 44 | 3325 | 14551 | |
400-499K | 212 | 2675 | 11122 | |
500K+ | 633 | 5321 | 17133 | |
Total Working Age Population | 6,244 | 71,337 | 212,927 | |
In Work Force | 4,651 | 53,731 | 154,177 | |
Not In Work Force | 1,593 | 17,606 | 58,750 | |
Workforce Employed | 4,478 | 51,518 | 148,476 | |
Workforce Unemployed | 173 | 2,133 | 5,535 | |
Civlian Workforce | 4,651 | 53,652 | 154,011 | |
Military Workforce | 0 | 79 | 166 | |
Total Households | 3,952 | 37,856 | 103,612 | |
Family Households | 1,643 | 21,949 | 70,346 | |
Non-Family Households | 2,310 | 15,907 | 33,266 | |
Married Couple | 1,269 | 18,396 | 59,084 | |
Other Family | 374 | 3,553 | 11,261 | |
Married w/Child | 550 | 9,707 | 30,700 | |
Single Male w/Child | 12 | 548 | 1,411 | |
Single Female w/Child | 193 | 1,432 | 4,726 |
Population Change Last Two Decades - Plus Projection
2000 | % | 2010 | % | 2020 | % | 2030 | |
---|---|---|---|---|---|---|---|
Texas | 20,851,820 | +21 | 25,145,561 | +18 | 29,677,668 | +18 | 34,894,452 |
Denton County | 432,976 | +53 | 662,614 | +36 | 897,953 | +37 | 1,234,110 |
Collin County | 491,675 | +59 | 782,341 | +33 | 1,039,369 | +34 | 1,391,461 |
Total Working Age Population:
Total Households:
Total Working Age Population:
Total Households:
Total Working Age Population:
Total Households: