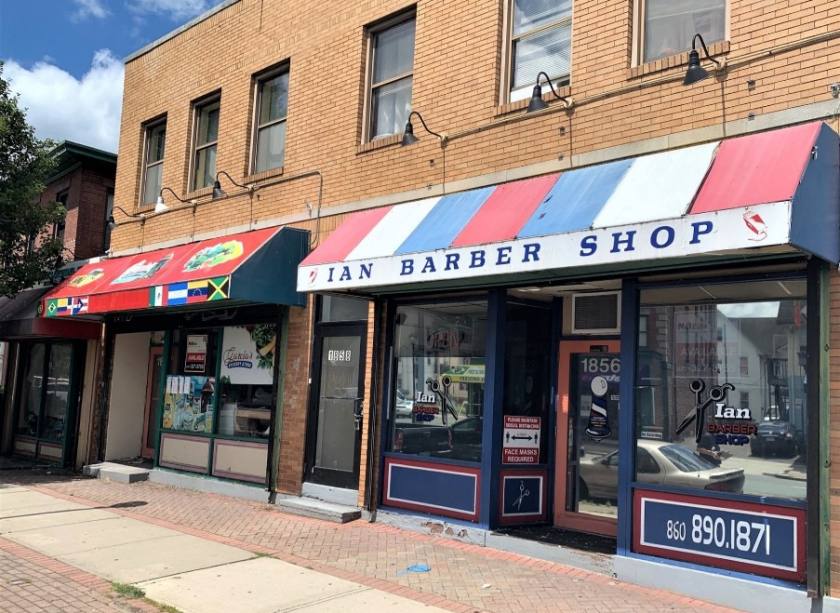
Retail Space
1856 Park Street Hartford, CT 06106
1856 Park Street Hartford, CT 06106
Details & Description
Property Highlights
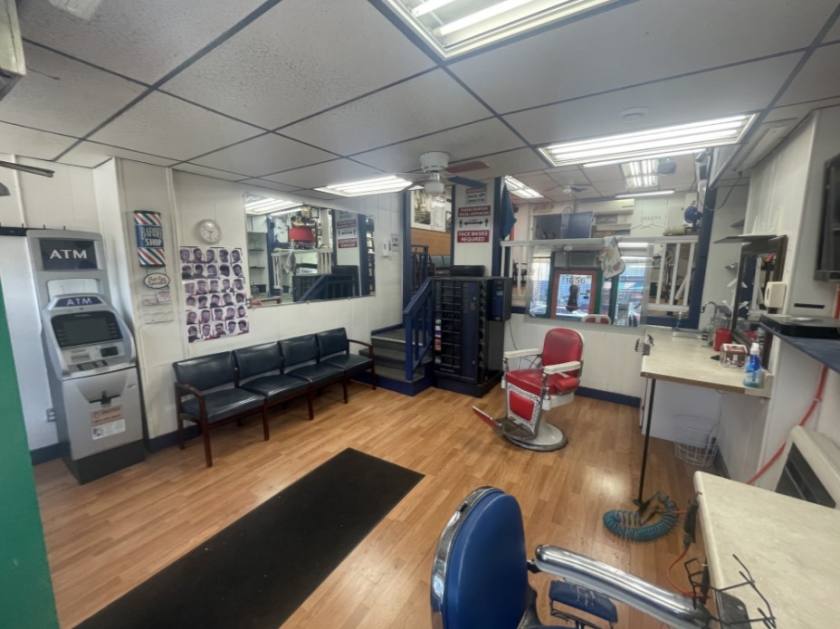
- • 13 Waiting Room Chairs
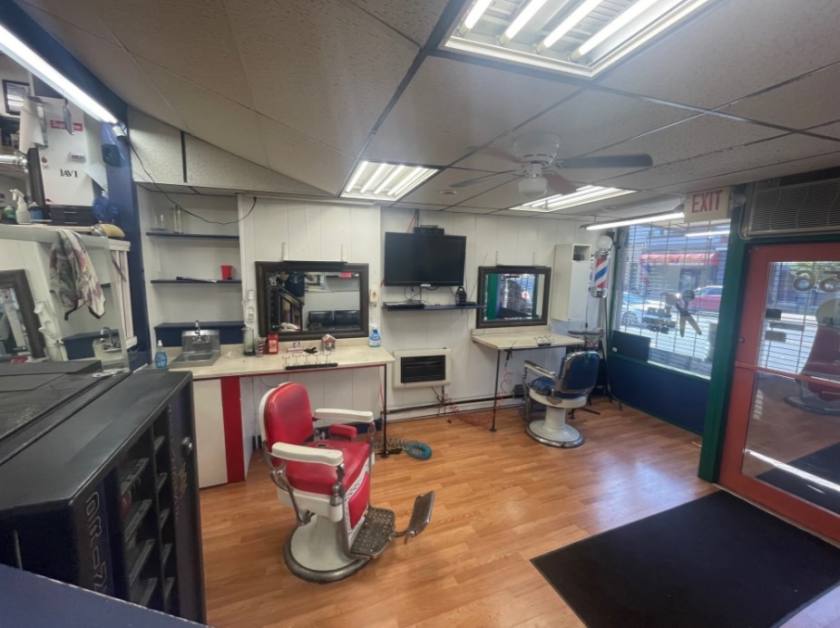
- • 5 Barber Chairs
- • Split Level Layout
- • Basement
Additional Photos

Listing Agents

Carl Berman
O: 877-327-3755
M: 860-841-3821
cberman@naielite.com
O: 877-327-3755
M: 860-841-3821
cberman@naielite.com
While we strive to provide the most accurate information, all listing information, and demographic data, is provided by third-parties. As such, MyEListing will not be responsible for the accuracy of the information. It is strongly recommended that you verify all information with the listing agent, and any relevant agencies, prior to making any decisions.


