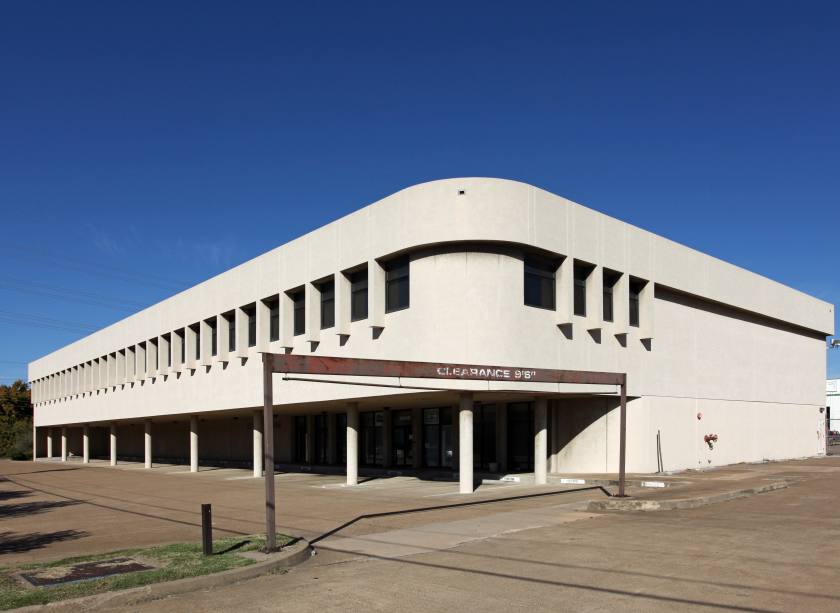
1-Mile | 3-Miles | 5-Miles | ||
---|---|---|---|---|
Total Population | 4,185 | 82,241 | 232,988 | |
Population Median Age | 31 | 34 | 35 | |
Population by Age | 0-9 Yrs | 717 (17%) | 12037 (14%) | 33022 (14%) |
10-19 Yrs | 671 (16%) | 10568 (12%) | 28734 (12%) | |
20-29 Yrs | 644 (15%) | 13927 (16%) | 37662 (16%) | |
30-39 Yrs | 899 (21%) | 16114 (19%) | 40177 (17%) | |
40-49 Yrs | 523 (12%) | 10669 (12%) | 31775 (13%) | |
50-59 Yrs | 378 (9%) | 9318 (11%) | 27850 (11%) | |
60-69 Yrs | 210 (5%) | 5956 (7%) | 19208 (8%) | |
70+ Yrs | 141 (3%) | 3652 (4%) | 14560 (6%) | |
Median HH Income | $56,796 | $63,408 | $71,003 | |
Total Household Income | < 24K | 163 (11%) | 4451 (14%) | 10924 (12%) |
25-49K | 448 (32%) | 7881 (25%) | 18995 (21%) | |
50-74K | 328 (23%) | 5732 (18%) | 16441 (18%) | |
75-99K | 195 (14%) | 3800 (12%) | 11610 (13%) | |
100-199K | 210 (15%) | 6398 (20%) | 19625 (22%) | |
200K+ | 34 (2%) | 2439 (7%) | 10005 (11%) | |
Highest Education Level | No Diploma | 1069 | 17396 | 34730 |
Diploma or GED | 479 | 9886 | 26810 | |
Some College | 307 | 7435 | 21627 | |
Assoc. Degree | 53 | 1916 | 7049 | |
Bachelors Degree | 465 | 11252 | 39507 | |
Higher Degree | 160 | 6058 | 26425 | |
Total Housing Units | 1,505 | 34,272 | 96,434 | |
--Owner-Occupied | 395 | 10,721 | 37,307 | |
--Renter-Occupied | 983 | 19,981 | 50,292 | |
Owner-Occupied Values | < 100K | 116 | 847 | 2635 |
100-199K | 117 | 2432 | 9356 | |
200-299K | 125 | 2445 | 6942 | |
300-399K | 24 | 1973 | 4868 | |
400-499K | 10 | 1277 | 3536 | |
500K+ | 5 | 1746 | 9970 | |
Total Working Age Population | 3,058 | 64,103 | 182,781 | |
In Work Force | 2,348 | 48,344 | 133,667 | |
Not In Work Force | 710 | 15,760 | 49,114 | |
Workforce Employed | 2,289 | 46,222 | 128,320 | |
Workforce Unemployed | 59 | 2,122 | 5,198 | |
Civlian Workforce | 2,348 | 48,344 | 133,518 | |
Military Workforce | 0 | 0 | 149 | |
Total Households | 1,378 | 30,701 | 87,598 | |
Family Households | 993 | 18,893 | 55,972 | |
Non-Family Households | 386 | 11,808 | 31,626 | |
Married Couple | 689 | 13,290 | 41,298 | |
Other Family | 304 | 5,603 | 14,674 | |
Married w/Child | 397 | 6,679 | 19,690 | |
Single Male w/Child | 30 | 878 | 1,912 | |
Single Female w/Child | 159 | 2,042 | 5,272 |
Population Change Last Two Decades - Plus Projection
2000 | % | 2010 | % | 2020 | % | 2030 | |
---|---|---|---|---|---|---|---|
Texas | 20,851,820 | +21 | 25,145,561 | +18 | 29,677,668 | +18 | 34,894,452 |
Dallas County | 2,218,899 | +7 | 2,368,139 | +15 | 2,734,111 | +14 | 3,106,298 |
Total Working Age Population:
Total Households:
Total Working Age Population:
Total Households:
Total Working Age Population:
Total Households: