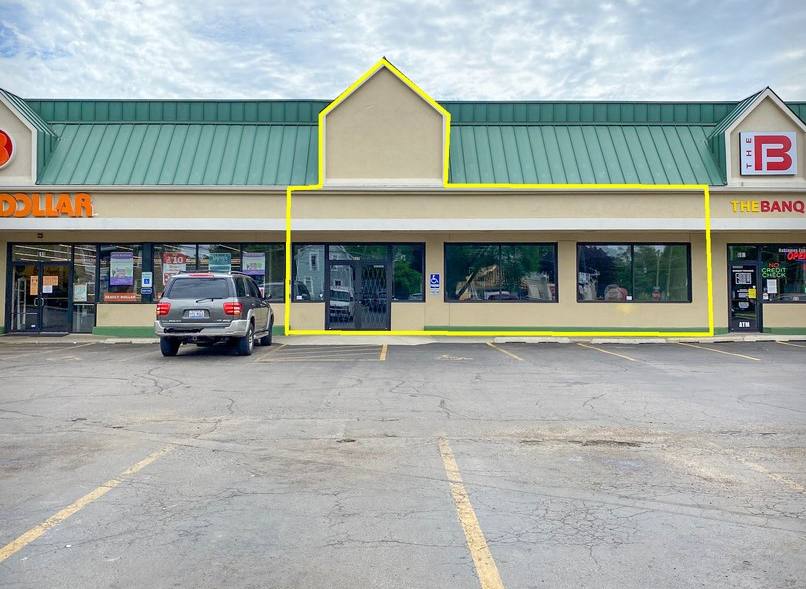
Retail Space
609 - 611 Dundee Ave Elgin, IL 60120
609 - 611 Dundee Ave Elgin, IL 60120
Details & Description
Property Highlights
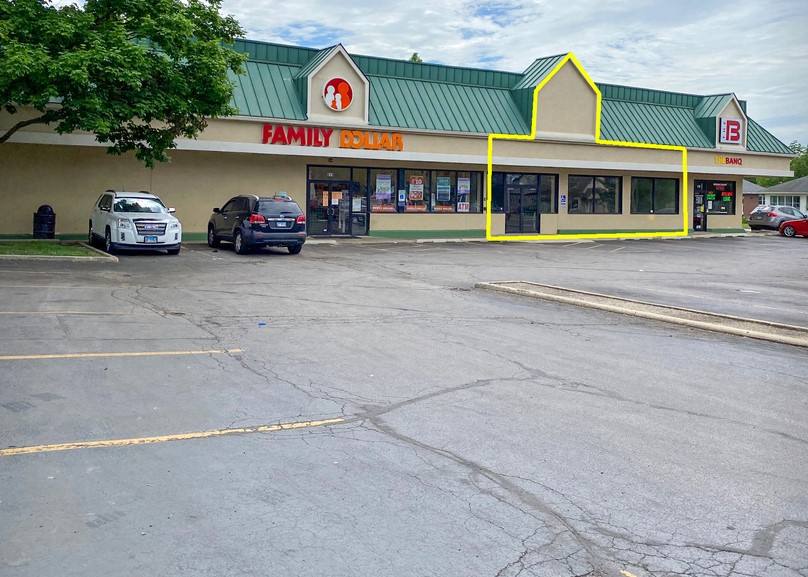
- • Flexible space
- • Pylon signage available
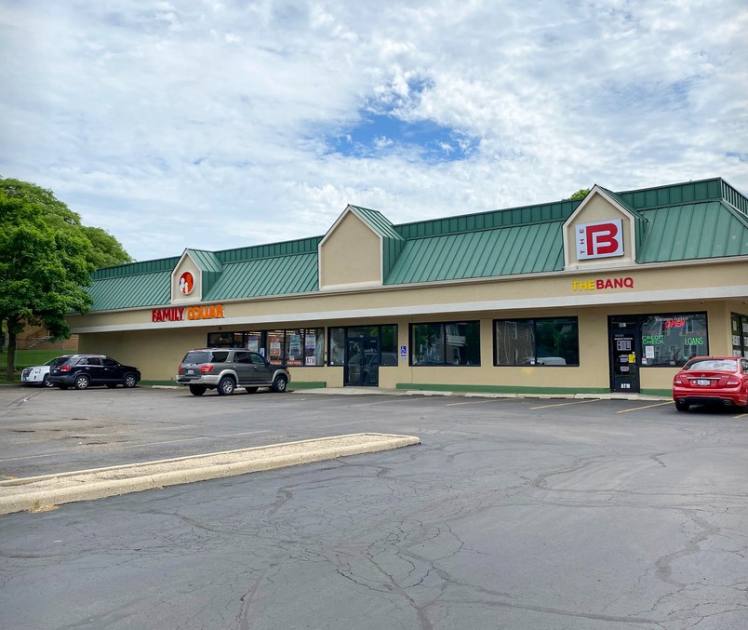
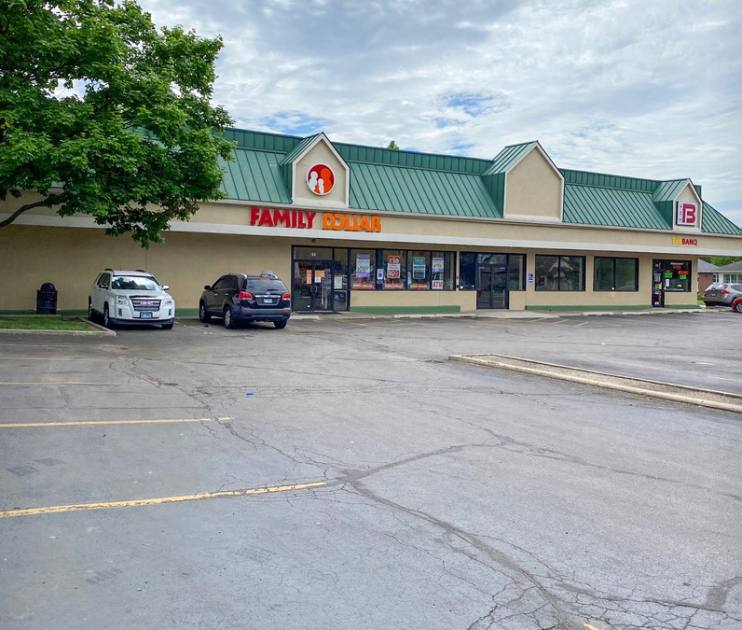
- • Ample parking
Additional Photos
Listing Agents

Autumn Psaros
O: 224-218-5447
M: 574-707-5434
autumn@catoncommercial.com
O: 224-218-5447
M: 574-707-5434
autumn@catoncommercial.com
While we strive to provide the most accurate information, all listing information, and demographic data, is provided by third-parties. As such, MyEListing will not be responsible for the accuracy of the information. It is strongly recommended that you verify all information with the listing agent, and any relevant agencies, prior to making any decisions.


