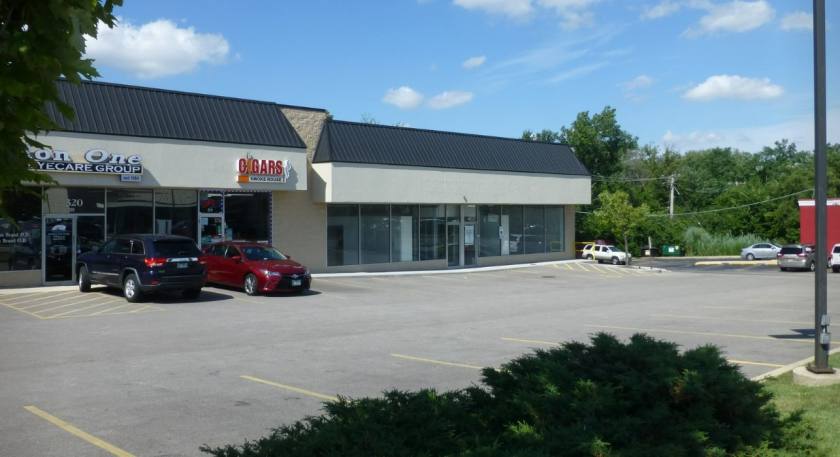
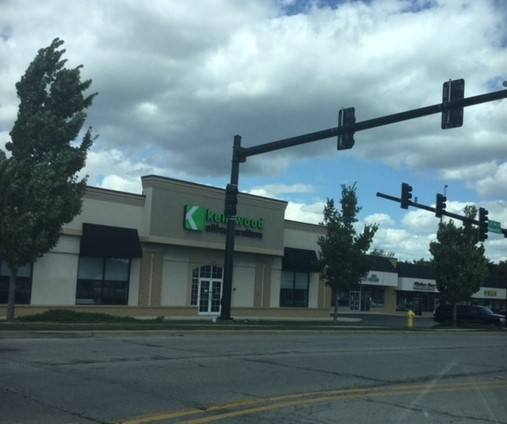
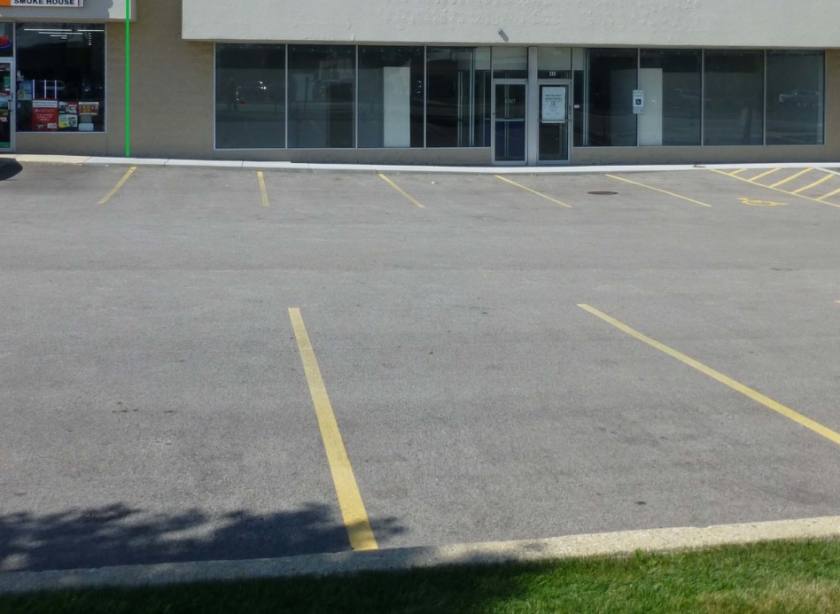
1-Mile | 3-Miles | 5-Miles | ||
---|---|---|---|---|
Total Population | 15,668 | 100,243 | 269,766 | |
Population Median Age | 37 | 39 | 39 | |
Population by Age | 0-9 Yrs | 1923 (12%) | 12770 (12%) | 34397 (12%) |
10-19 Yrs | 1795 (11%) | 12110 (12%) | 34930 (12%) | |
20-29 Yrs | 2996 (19%) | 12881 (12%) | 34849 (12%) | |
30-39 Yrs | 2524 (16%) | 13886 (13%) | 34598 (12%) | |
40-49 Yrs | 1689 (10%) | 12074 (12%) | 33727 (12%) | |
50-59 Yrs | 1836 (11%) | 13674 (13%) | 35964 (13%) | |
60-69 Yrs | 1644 (10%) | 11156 (11%) | 31806 (11%) | |
70+ Yrs | 1259 (8%) | 11692 (11%) | 29495 (10%) | |
Median HH Income | $82,482 | $91,634 | $91,898 | |
Total Household Income | < 24K | 653 (11%) | 4069 (10%) | 11329 (11%) |
25-49K | 972 (17%) | 5461 (14%) | 14680 (14%) | |
50-74K | 940 (16%) | 5952 (15%) | 15792 (15%) | |
75-99K | 968 (16%) | 5377 (14%) | 12818 (12%) | |
100-199K | 1794 (31%) | 11853 (31%) | 30567 (30%) | |
200K+ | 382 (6%) | 5409 (14%) | 15745 (15%) | |
Highest Education Level | No Diploma | 442 | 3083 | 11563 |
Diploma or GED | 1794 | 12803 | 32765 | |
Some College | 2248 | 12050 | 31109 | |
Assoc. Degree | 868 | 4534 | 12661 | |
Bachelors Degree | 3886 | 23354 | 58129 | |
Higher Degree | 1566 | 13246 | 36212 | |
Total Housing Units | 6,333 | 40,398 | 106,560 | |
--Owner-Occupied | 3,141 | 27,719 | 72,437 | |
--Renter-Occupied | 2,569 | 10,403 | 28,492 | |
Owner-Occupied Values | < 100K | 275 | 1312 | 2989 |
100-199K | 705 | 4064 | 9624 | |
200-299K | 1265 | 8766 | 20799 | |
300-399K | 519 | 5759 | 14823 | |
400-499K | 226 | 2798 | 8029 | |
500K+ | 150 | 5020 | 16173 | |
Total Working Age Population | 12,725 | 80,232 | 214,996 | |
In Work Force | 9,134 | 54,637 | 145,582 | |
Not In Work Force | 3,591 | 25,595 | 69,414 | |
Workforce Employed | 8,826 | 52,384 | 139,249 | |
Workforce Unemployed | 308 | 2,245 | 6,214 | |
Civlian Workforce | 9,134 | 54,630 | 145,463 | |
Military Workforce | 0 | 7 | 120 | |
Total Households | 5,709 | 38,122 | 100,929 | |
Family Households | 3,800 | 25,893 | 68,141 | |
Non-Family Households | 1,909 | 12,228 | 32,788 | |
Married Couple | 2,968 | 21,532 | 55,942 | |
Other Family | 832 | 4,361 | 12,199 | |
Married w/Child | 1,373 | 9,094 | 24,463 | |
Single Male w/Child | 86 | 400 | 1,425 | |
Single Female w/Child | 285 | 1,477 | 3,956 |
Population Change Last Two Decades - Plus Projection
2000 | % | 2010 | % | 2020 | % | 2030 | |
---|---|---|---|---|---|---|---|
Illinois | 12,419,293 | +3 | 12,830,632 | +12 | 14,316,487 | +6 | 15,138,849 |
DuPage County | 904,161 | +1 | 916,924 | +10 | 1,010,323 | +2 | 1,034,039 |
Total Working Age Population:
Total Households:
Total Working Age Population:
Total Households:
Total Working Age Population:
Total Households: